a) Calculate the correlation coefficient from the following data on hourly sales (x) and expenses (y) of 7 stores: x: 70 66 68 71 69 65 67 y: 72 68 69 69 72 67 66 Explain your result. b) To study the tensile strength of a certain type of wire, the following pairs of observations were recorded, where x is the diameter in cm and y is the mass supported in kg/cm. x: 0.6 1.4 0.8 1.0 1.2 1.6 1.8 2.0 2.2 2.4 y: 14 26 50 56 42 98 82 88 134 124 Calculate the least-squares regression line and extrapolate the regression line to a diameter of 0.2 cm. Also explain your result.
a) Calculate the correlation coefficient from the following data on hourly sales (x) and expenses (y) of 7 stores: x: 70 66 68 71 69 65 67 y: 72 68 69 69 72 67 66 Explain your result. b) To study the tensile strength of a certain type of wire, the following pairs of observations were recorded, where x is the diameter in cm and y is the mass supported in kg/cm. x: 0.6 1.4 0.8 1.0 1.2 1.6 1.8 2.0 2.2 2.4 y: 14 26 50 56 42 98 82 88 134 124 Calculate the least-squares regression line and extrapolate the regression line to a diameter of 0.2 cm. Also explain your result.

Glencoe Algebra 1, Student Edition, 9780079039897, 0079039898, 2018
18th Edition
ISBN:9780079039897
Author:Carter
Publisher:Carter
Chapter10: Statistics
Section10.1: Measures Of Center
Problem 9PPS

Related questions
Question
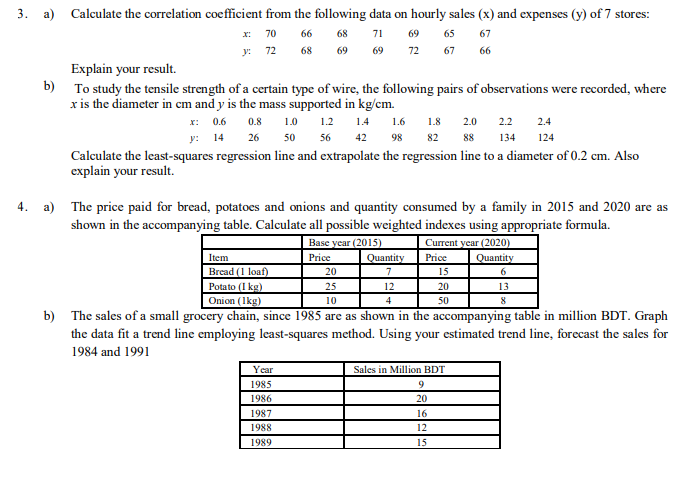
Transcribed Image Text:3. a) Calculate the correlation coefficient from the following data on hourly sales (x) and expenses (y) of 7 stores:
x: 70
66
68
71
69
65
67
y: 72
68
69
69
72
67
66
Explain your result.
b) To study the tensile strength of a certain type of wire, the following pairs of observations were recorded, where
x is the diameter in cm and y is the mass supported in kg/cm.
x: 0.6
0.8 1.0 1.2 1.4 1.6
1.8
2.0
2.2
2.4
y: 14
26
50
56
42
98
82
88
134
124
Calculate the least-squares regression line and extrapolate the regression line to a diameter of 0.2 cm. Also
explain your result.
4. a) The price paid for bread, potatoes and onions and quantity consumed by a family in 2015 and 2020 are as
shown in the accompanying table. Calculate all possible weighted indexes using appropriate formula.
Base year (2015)
Current year (2020)
Quantity
Price
Item
Bread (1 loaf)
Potato (I kg)
Onion (Ikg)
Quantity
7.
Price
20
15
6.
25
12
20
13
10
4
50
8
b) The sales of a small grocery chain, since 1985 are as shown in the accompanying table in million BDT. Graph
the data fit a trend line employing least-squares method. Using your estimated trend line, forecast the sales for
1984 and 1991
Year
Sales in Million BDT
1985
9.
1986
20
1987
16
1988
12
1989
15
Expert Solution
This question has been solved!
Explore an expertly crafted, step-by-step solution for a thorough understanding of key concepts.

This is a popular solution!

Trending now
This is a popular solution!

Step by step
Solved in 3 steps

Recommended textbooks for you
Glencoe Algebra 1, Student Edition, 9780079039897…
Algebra
ISBN:
9780079039897
Author:
Carter
Publisher:
McGraw Hill
Glencoe Algebra 1, Student Edition, 9780079039897…
Algebra
ISBN:
9780079039897
Author:
Carter
Publisher:
McGraw Hill