The following data concern the divorce rate (y) per 1,000 women and the percentage of the feme population in the labour force (x). Use a nonparametric test based on ranks to determine whether t divorce rate is positively correlated with the percentage of women in the labour force. 1930 1940 1950 1960 1970 Year Divorce Rate 1890 1900 1910 1920 92 80 74 85 71 68 81 82 80 % of Females in Labour 94 86 72 91 70 77 89 37 86 Force (r)
The following data concern the divorce rate (y) per 1,000 women and the percentage of the feme population in the labour force (x). Use a nonparametric test based on ranks to determine whether t divorce rate is positively correlated with the percentage of women in the labour force. 1930 1940 1950 1960 1970 Year Divorce Rate 1890 1900 1910 1920 92 80 74 85 71 68 81 82 80 % of Females in Labour 94 86 72 91 70 77 89 37 86 Force (r)

Glencoe Algebra 1, Student Edition, 9780079039897, 0079039898, 2018
18th Edition
ISBN:9780079039897
Author:Carter
Publisher:Carter
Chapter4: Equations Of Linear Functions
Section4.5: Correlation And Causation
Problem 24PFA

Related questions
Question
Please answer fast
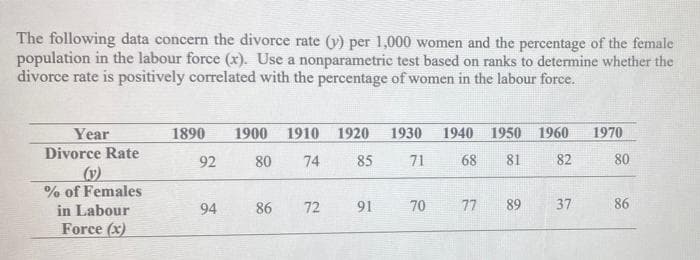
Transcribed Image Text:The following data concern the divorce rate (y) per 1,000 women and the percentage of the female
population in the labour force (x). Use a nonparametric test based on ranks to determine whether the
divorce rate is positively correlated with the percentage of women in the labour force.
Year
1890
1900 1910
1920
1930
1940 1950 1960
1970
Divorce Rate
92
80
74
85
71
68
81
82
80
(v)
% of Females
in Labour
94
86
72
91
70
77
89
37
86
Force (x)
Expert Solution
This question has been solved!
Explore an expertly crafted, step-by-step solution for a thorough understanding of key concepts.

Step by step
Solved in 2 steps

Recommended textbooks for you
Glencoe Algebra 1, Student Edition, 9780079039897…
Algebra
ISBN:
9780079039897
Author:
Carter
Publisher:
McGraw Hill
Glencoe Algebra 1, Student Edition, 9780079039897…
Algebra
ISBN:
9780079039897
Author:
Carter
Publisher:
McGraw Hill