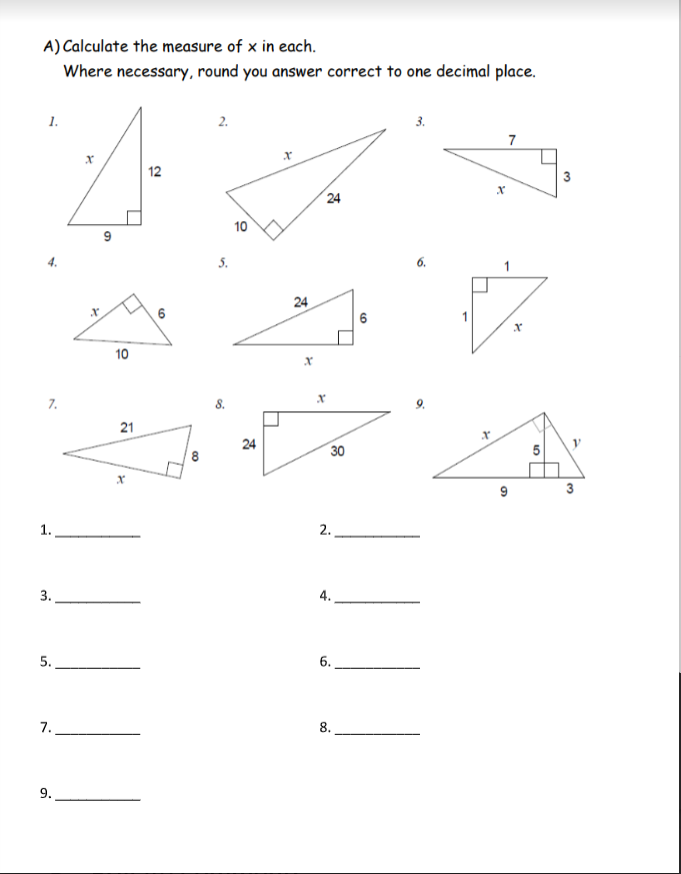
A) Calculate the measure of x in each. Where necessary, round you answer correct to one decimal place. 1. 2. 7 12 3 24 10 5. 6. 24 6 6 10 7. 8. 21 24 it 30 5 3 1. 2. 4. 3.
Q: Given the data set 13 12 599, find the following values. Round your answers to 4 decimal places if…
A: Use formula for mean and sample standard deviation s as following:-
Q: (a) Show that in finding the A.M. of a set of readings on a thermometer, it does not matter whether…
A:
Q: Let p be the population proportion for the following condition. Find the point estimates for p and…
A: We have given that n = 2091x =4048
Q: The width of each bar in a histogram corresponds to the: O Anumber of observations in the class O B.…
A: We need to answer the question using concept of Histogram ( Graphical Methods)
Q: Tell each of the following situations whether it requires descriptive or ir statistics. 4. The…
A: Descriptive Statistics is used to summarize and graph the given sample data for better understanding…
Q: The depths (in inches) at which 10 artifacts are found are listed. Complete parts (a) and (b) below.…
A:
Q: Given are the scores of 10 employees from their 20-point assessment 16 18 10 8 12 15 19 17 16 7…
A:
Q: The following five observations are observed repair times for an airplane engine: 3.6, 23.3, 31.5,…
A: The data set is given as 3.6, 23.3, 31.5, 17.9 and 4
Q: The following models have the indicated AIC values. Which is the best model based on this metric?…
A:
Q: A survey of 18 people is carried out to understand about their working life. The results are shown…
A:
Q: The researcher makes the following statement: "The mean flash brightness of male Photinus carolinus…
A: Hypothesis: Hypothesis is an assertion (or) statement about the population parameter. The…
Q: The depths (in inches) at which 10 artifacts are found are listed. Complete parts (a) and (b) below.…
A: Solution
Q: Identify the number of significant figures (sig figs) in each of the values. I sig fig 2 sig figs 3…
A: We can find the significant figures.
Q: -Find the mode from the following data : Values Frequency Values Frequency Below 50 97 Below 30 60…
A:
Q: Given are the scores of 10 employees from their 20-point assessment 16 18 10 8 12 15 19 17 16 7…
A: Given : n = 10 Data: 16,18,10,8,12,15,19,17,16,7
Q: Given the following information: Class Interval 10-20 20-30 30-40 Frequency 12 Calculate Less than…
A: Given: Class interval 10-20 20-30 30-40 Frequency 6 8 12
Q: A circle in which sectors represent various quantities is called. . O a. Histogram O b. None of…
A: We have to find type of graph which represent various quantities..
Q: From the data given belaw construct Dorbish & Bowley's Price Index Number. Commodity poqo pı/po…
A: Formula for calculating Dorbish and bowley's price index number is given by,
Q: A keen angler kept a record of the weight of each of his last 51 catches of fish. The weights,…
A: The data is as follows, weight Frequency 0.0-0.4 9 0.5-0.9 12 1.0-1.2 8 1.3-1.7 8…
Q: Twenty-six football players ran a lap after practice. Their lap times in seconds are shown in the…
A: From given stem and leaf the data values…
Q: 3. Draw a histogram and locate mode from the following and verify with actual calculation. Class…
A:
Q: 3. The test scores of 15 students are listed below: 43 46 50 55 58 62 66 71 74 79 85 87 90 94 120 a)…
A: (a) To calculate 5 number summary for the given data: Minimum value is 43 Maximum value is 120…
Q: Five measurements of a distance were recorded as 62.78, 62.62, 62.47, 62.59, and 62.43 meters and…
A:
Q: 6. Given the following pairs of corresponding values of X and Y: X: 20 25 30 35 40 Y: 73 198 573…
A: We have given that, The pairs of corresponding values of X and Y are :- X :- 20, 25, 30,…
Q: The depths (in inches) at which 10 artifacts are found are listed. Complete parts (a) and (b) below.…
A: The depths in inches are found as listed. We have to find the range of the data set.
Q: 4.41. Which of the following is a measure dispersion? a. Median b. Mode c. Average d. Interquartile…
A: Hey there! Thank you for posting the question. Since there are multiple questions posted, we will…
Q: ased on the histogram above, what is the frequency of the class containing the value 2 8- Frequency
A: we have to find frequency of class containing the value 2
Q: QUES Calculate the mean of the following a 10-14 16 15-19 20-24 12 25-29 4 TOTAL 40 O 1.95 O 18.5 O…
A: Solution: Class Frequency(f) Midpoint (x) fx 10 - 14 8 12 96 15 -19 16 17 272 20 - 24 12…
Q: The width of each bar in a histogram corresponds to the: O a. the midpoint of the class. O b.…
A: A histogram is a graphical representation of the distribution of numerical data. The frequency…
Q: 1. The following are final score grades. Fill in the frequencies: Score 4 3 3 1 3 4 55 2 3 4 3 4 3 4…
A: Note: As per my policy i can answer only one question. kindly repost the remaining questions 1)…
Q: The lengths and weights of a zoo's pygmy shrews were recorded during their annual health chec Length…
A: Obtain the value of the spearman’s rank correlation coefficient. The value of the spearman’s rank…
Q: 100 110 120 130 140 150 Answer the following questions: (a) What is the range of the measurements?…
A:
Q: Create a 99% con fidence interval for the data set below. 64 61 54 70 60 | 56 64 59 55 61| 59 (three…
A: Given that Data values - 64 , 61, 54, 70 , 60 , 56, 64 , 59 , 55 , 61 , 59 Number of data values…
Q: Let x be the percentage of 16- to 19-year-olds not in school and not high school graduates. Let y be…
A: Hi, We can only solve 3 subparts per session. Since you haven't mentioned which subparts you'd like…
Q: Use table below to find h(5). Boy's Age Average Height in Inches 6 months 26 12 months 30 18 months…
A:
Q: Astudy w condcto determine he proportion of people who dream in black and white instead of color…
A: The question is based on hypo. testing of difference between two popl. prop. Given : No. of people…
Q: On this assignment, round all answers (when necessary) to exactly three decimal places. The numbers…
A: Interquartile range is the difference between the median of the upper(Q3) and the lower half(Q1) of…
Q: Based on the frequency polygon above, what could be the initial lower bound interval? * Test Scores…
A: Frequency is the count of individual observations. If all the individual frequencies are marked in a…
Q: The lengths and weights of a zoo's pygmy shrews were recorded during their annual health check.…
A: Given data: X Y 95 5.4 83 4.5 91 5 82 1.1 75 3.7 62 2.6 79 4.5 63 3.1 81 4.7…
Q: se the followwing information to complete the test. oserved times (Minutes): 5.60 4.18 5.31 5.18…
A: *Answer:
Q: Blood Pressure Measurements Fourteen different second-year medical students at Bellevue Hospital…
A: For the given data construct boxplot and identify the five number summary.Software…
Q: Complete the table below to answer some of these items. Class Interval (C. I.) | Frequency Class…
A: Since we know that the class boundaries are calculated by subtracting 0.5 from the lower- class…
Q: our assignment is to survey 10 people (friends, family, peers, etc.) and collect data for the…
A: dependent measure of data is:
Q: The depths (in inches) at which 10 artifacts are found are listed. 22.2 25.9 25.2 40.4 44.9 25.4…
A: Range : In statistics , range is measure of spread . It is the difference between highest and…
Q: Use the information below to answer questions 13-15 Tonya surveyed the 8th grade students at her 14.…
A: From the table, we see that the total of the first row is 180 One element is 100 So the other…
Q: Let p be the population proportion for the following condition. Find the point estimates for p and…
A: A study of 4407 adults from country A, 2801 think mainstream media is more interested in making…
Q: 2. Choose intervals and construct the histogram to represent 100-meters dash time. 61 71 68 n 68 69…
A: The given data is 61, 61, 62, 63, 64, 64, 68, 68, 68, 69, 70, 71, 72, 73, 74, 75, 76, 78, 80, 82
Q: Given a data set with и 3D 18 аnd o — find the percent of data within each range: Just type the…
A: As per company guidelines I solved exactly three subparts of the question.thank you
Q: A population data set produced the following information. N= 30 Σx 9980, Σy= 1455, Σw= 85,040 E2 =…
A: The given is, N=250, Σx=9980, Σy=1455, Σxy=85,040Σx2=486,820 Σy2=136,745
Q: (c) Specify the level of measurement (nominal-level, ordinal-level, interval-level or ratio-level)…
A: (1) Acceleration of car :- Answer= Interval-level Time needed to accelerate car to some velocity.…
Hi. Can you please answer numbers 4, 5 and 6 clearly? Thank you
Trending now
This is a popular solution!
Step by step
Solved in 2 steps with 1 images