Twenty-six football players ran a lap after practice. Their lap times in seconds are shown in the following stem-and-leaf plot. 3 4 8 7. 1 1 6 8 9 9 8. 01 2 2 8. 59 9. 3 4 Leaf unit = 1.0 s What is the median lap time? Give your answer precise to one decimal place. median = 1.
Twenty-six football players ran a lap after practice. Their lap times in seconds are shown in the following stem-and-leaf plot. 3 4 8 7. 1 1 6 8 9 9 8. 01 2 2 8. 59 9. 3 4 Leaf unit = 1.0 s What is the median lap time? Give your answer precise to one decimal place. median = 1.

Glencoe Algebra 1, Student Edition, 9780079039897, 0079039898, 2018
18th Edition
ISBN:9780079039897
Author:Carter
Publisher:Carter
Chapter10: Statistics
Section10.5: Comparing Sets Of Data
Problem 26PFA

Related questions
Question
I need help finding the answer please
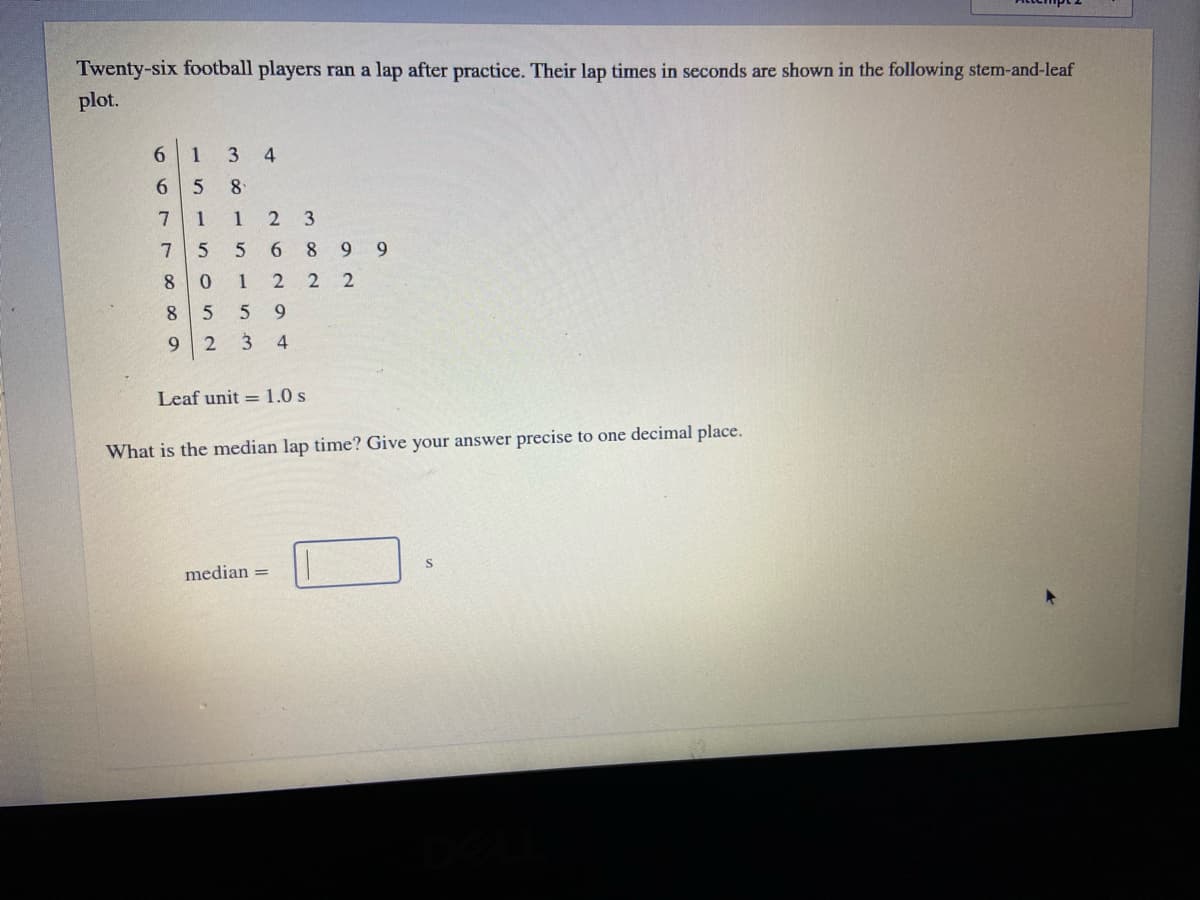
Transcribed Image Text:Twenty-six football players ran a lap after practice. Their lap times in seconds are shown in the following stem-and-leaf
plot.
6.
1
3
6 5
8
7
1
1
2 3
6.
8
6.
8.
1
9.
9.
3 4
Leaf unit = 1.0 s
What is the median lap time? Give your answer precise to one decimal place.
median =
Expert Solution
This question has been solved!
Explore an expertly crafted, step-by-step solution for a thorough understanding of key concepts.

This is a popular solution!

Trending now
This is a popular solution!

Step by step
Solved in 2 steps

Recommended textbooks for you
Glencoe Algebra 1, Student Edition, 9780079039897…
Algebra
ISBN:
9780079039897
Author:
Carter
Publisher:
McGraw Hill
Glencoe Algebra 1, Student Edition, 9780079039897…
Algebra
ISBN:
9780079039897
Author:
Carter
Publisher:
McGraw Hill