A car company developed a certain car model to appeal to young consumers. The car company claims the average age of drivers of this certain car model is 26.00 years old. Suppose a random sample of 18 drivers was drawn, and the average age of the drivers was found to be 29.80 years. Assume the standard deviation for the age of the car drivers to be 2.9 years. Complete parts a through c below. a. Construct a 95% confidence interval to estimate the average age of the car driver. The 95% confidence interval for the average age of the car driver has a lower limit of years old and an upper limit of years old. (Round to two decimal places as needed.) b. Does this result lend support to the car company's claim? O A. Yes, because the interval includes the company's claimed average age. O B. No, because the interval includes the company's claimed average age. OC. Yes, because the interval does not include the company's claimed average age. O D. No, because the interval does not include the company's claimed average age. c. What assumption needs to be made to construct this interval? O A. The population mean for the model's drivers will be in the confidence interval. O B. The population of all car drivers' ages is normally distributed.
A car company developed a certain car model to appeal to young consumers. The car company claims the average age of drivers of this certain car model is 26.00 years old. Suppose a random sample of 18 drivers was drawn, and the average age of the drivers was found to be 29.80 years. Assume the standard deviation for the age of the car drivers to be 2.9 years. Complete parts a through c below. a. Construct a 95% confidence interval to estimate the average age of the car driver. The 95% confidence interval for the average age of the car driver has a lower limit of years old and an upper limit of years old. (Round to two decimal places as needed.) b. Does this result lend support to the car company's claim? O A. Yes, because the interval includes the company's claimed average age. O B. No, because the interval includes the company's claimed average age. OC. Yes, because the interval does not include the company's claimed average age. O D. No, because the interval does not include the company's claimed average age. c. What assumption needs to be made to construct this interval? O A. The population mean for the model's drivers will be in the confidence interval. O B. The population of all car drivers' ages is normally distributed.

MATLAB: An Introduction with Applications
6th Edition
ISBN:9781119256830
Author:Amos Gilat
Publisher:Amos Gilat
Chapter1: Starting With Matlab
Section: Chapter Questions
Problem 1P

Related questions

Question
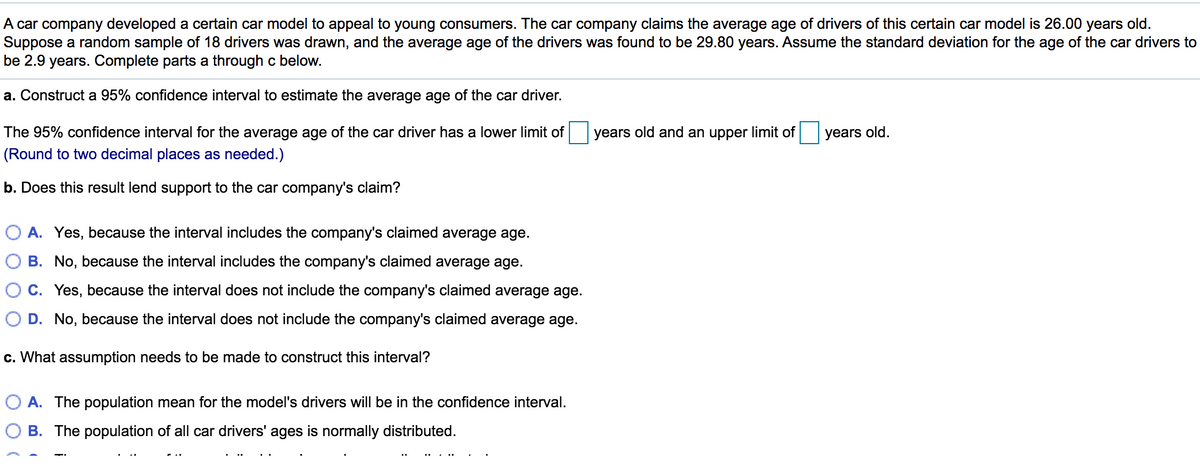
Transcribed Image Text:A car company developed a certain car model to appeal to young consumers. The car company claims the average age of drivers of this certain car model is 26.00 years old.
Suppose a random sample of 18 drivers was drawn, and the average age of the drivers was found to be 29.80 years. Assume the standard deviation for the age of the car drivers to
be 2.9 years. Complete parts a through c below.
a. Construct a 95% confidence interval to estimate the average age of the car driver.
The 95% confidence interval for the average age of the car driver has a lower limit of years old and an upper limit of
years old.
(Round to two decimal places as needed.)
b. Does this result lend support to the car company's claim?
O A. Yes, because the interval includes the company's claimed average age.
O B. No, because the interval includes the company's claimed average age.
C. Yes, because the interval does not include the company's claimed average age.
D. No, because the interval does not include the company's claimed average age.
c. What assumption needs to be made to construct this interval?
O A. The population mean for the model's drivers will be in the confidence interval.
B. The population of all car drivers' ages is normally distributed.
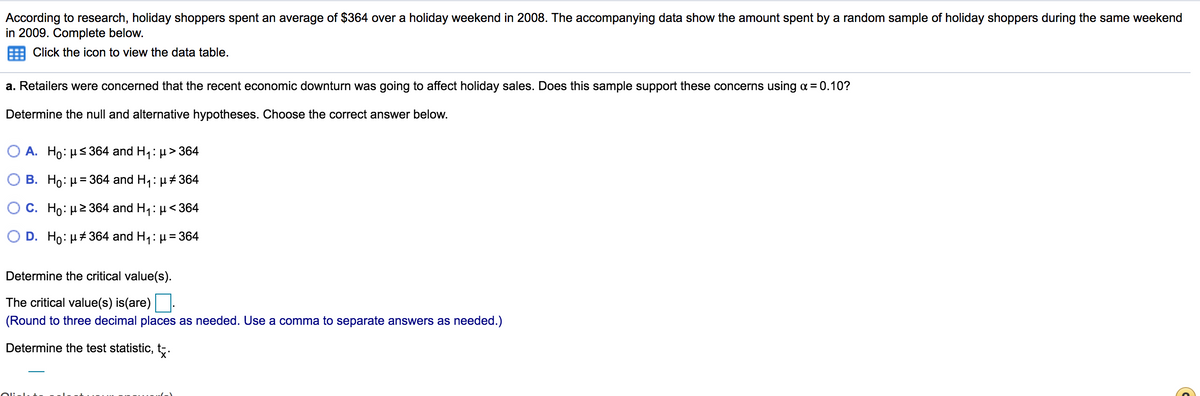
Transcribed Image Text:According to research, holiday shoppers spent an average of $364 over a holiday weekend in 2008. The accompanying data show the amount spent by a random sample of holiday shoppers during the same weekend
in 2009. Complete below.
Click the icon to view the data table.
a. Retailers were concerned that the recent economic downturn was going to affect holiday sales. Does this sample support these concerns using a = 0.10?
Determine the null and alternative hypotheses. Choose the correct answer below.
Ο Α. Ho: μ< 364 and H,: μ >364
B. Ho: H= 364 and H1: µ# 364
O C. Ho: µ2364 and H,: µ<364
D. Ho: H+ 364 and H,: µ = 364
Determine the critical value(s).
The critical value(s) is(are):
(Round to three decimal places as needed. Use a comma to separate answers as needed.)
Determine the test statistic, t.
Expert Solution
This question has been solved!
Explore an expertly crafted, step-by-step solution for a thorough understanding of key concepts.

Step by step
Solved in 3 steps with 2 images

Knowledge Booster


Learn more about
Need a deep-dive on the concept behind this application? Look no further. Learn more about this topic, statistics and related others by exploring similar questions and additional content below.Recommended textbooks for you
MATLAB: An Introduction with Applications
Statistics
ISBN:
9781119256830
Author:
Amos Gilat
Publisher:
John Wiley & Sons Inc

Probability and Statistics for Engineering and th…
Statistics
ISBN:
9781305251809
Author:
Jay L. Devore
Publisher:
Cengage Learning

Statistics for The Behavioral Sciences (MindTap C…
Statistics
ISBN:
9781305504912
Author:
Frederick J Gravetter, Larry B. Wallnau
Publisher:
Cengage Learning
MATLAB: An Introduction with Applications
Statistics
ISBN:
9781119256830
Author:
Amos Gilat
Publisher:
John Wiley & Sons Inc
Probability and Statistics for Engineering and th…
Statistics
ISBN:
9781305251809
Author:
Jay L. Devore
Publisher:
Cengage Learning
Statistics for The Behavioral Sciences (MindTap C…
Statistics
ISBN:
9781305504912
Author:
Frederick J Gravetter, Larry B. Wallnau
Publisher:
Cengage Learning

Elementary Statistics: Picturing the World (7th E…
Statistics
ISBN:
9780134683416
Author:
Ron Larson, Betsy Farber
Publisher:
PEARSON

The Basic Practice of Statistics
Statistics
ISBN:
9781319042578
Author:
David S. Moore, William I. Notz, Michael A. Fligner
Publisher:
W. H. Freeman

Introduction to the Practice of Statistics
Statistics
ISBN:
9781319013387
Author:
David S. Moore, George P. McCabe, Bruce A. Craig
Publisher:
W. H. Freeman