A plant manager has collected productivity data for a sample of workers, intending to see whether there is a difference in the number of units they produce on Monday versus Thursday. The results (units produced) worker 1 3 4 6 7 8 9 Monday Thursday Given that standard deviation for the difference between the two sets is 3.767. Construct and interpret the 99% confidence interval for the mean difference in productivity between the days. 49 56 52 47 69 71 54 42 46 59 65 57 54 71 70 49 43 O a.- 1.22 ± 2.335 O b.- 1.22 + 4.213 O C.- 1.22 ± 2.066 O d.- 1.22 ± 12.63 O e.- 1.22 ± 7.005
A plant manager has collected productivity data for a sample of workers, intending to see whether there is a difference in the number of units they produce on Monday versus Thursday. The results (units produced) worker 1 3 4 6 7 8 9 Monday Thursday Given that standard deviation for the difference between the two sets is 3.767. Construct and interpret the 99% confidence interval for the mean difference in productivity between the days. 49 56 52 47 69 71 54 42 46 59 65 57 54 71 70 49 43 O a.- 1.22 ± 2.335 O b.- 1.22 + 4.213 O C.- 1.22 ± 2.066 O d.- 1.22 ± 12.63 O e.- 1.22 ± 7.005

MATLAB: An Introduction with Applications
6th Edition
ISBN:9781119256830
Author:Amos Gilat
Publisher:Amos Gilat
Chapter1: Starting With Matlab
Section: Chapter Questions
Problem 1P

Related questions
Question
100%
ASAP
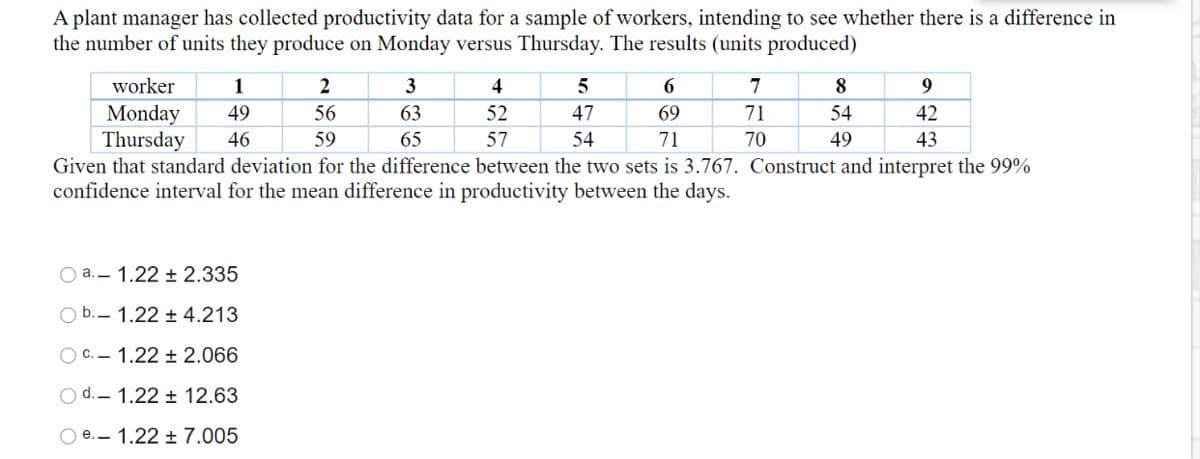
Transcribed Image Text:A plant manager has collected productivity data for a sample of workers, intending to see whether there is a difference in
the number of units they produce on Monday versus Thursday. The results (units produced)
worker
1
3
4
6
7
8
Monday
Thursday
Given that standard deviation for the difference between the two sets is 3.767. Construct and interpret the 99%
confidence interval for the mean difference in productivity between the days.
49
56
63
52
47
69
71
54
42
46
59
65
57
54
71
70
49
43
O a.- 1.22 ± 2.335
O b.- 1.22 ± 4.213
O c.– 1.22 ± 2.066
Od.- 1.22 ± 12.63
O e.- 1.22 ± 7.005
Expert Solution
This question has been solved!
Explore an expertly crafted, step-by-step solution for a thorough understanding of key concepts.

This is a popular solution!

Trending now
This is a popular solution!

Step by step
Solved in 2 steps with 2 images

Knowledge Booster


Learn more about
Need a deep-dive on the concept behind this application? Look no further. Learn more about this topic, statistics and related others by exploring similar questions and additional content below.Recommended textbooks for you
MATLAB: An Introduction with Applications
Statistics
ISBN:
9781119256830
Author:
Amos Gilat
Publisher:
John Wiley & Sons Inc

Probability and Statistics for Engineering and th…
Statistics
ISBN:
9781305251809
Author:
Jay L. Devore
Publisher:
Cengage Learning

Statistics for The Behavioral Sciences (MindTap C…
Statistics
ISBN:
9781305504912
Author:
Frederick J Gravetter, Larry B. Wallnau
Publisher:
Cengage Learning
MATLAB: An Introduction with Applications
Statistics
ISBN:
9781119256830
Author:
Amos Gilat
Publisher:
John Wiley & Sons Inc
Probability and Statistics for Engineering and th…
Statistics
ISBN:
9781305251809
Author:
Jay L. Devore
Publisher:
Cengage Learning
Statistics for The Behavioral Sciences (MindTap C…
Statistics
ISBN:
9781305504912
Author:
Frederick J Gravetter, Larry B. Wallnau
Publisher:
Cengage Learning

Elementary Statistics: Picturing the World (7th E…
Statistics
ISBN:
9780134683416
Author:
Ron Larson, Betsy Farber
Publisher:
PEARSON

The Basic Practice of Statistics
Statistics
ISBN:
9781319042578
Author:
David S. Moore, William I. Notz, Michael A. Fligner
Publisher:
W. H. Freeman

Introduction to the Practice of Statistics
Statistics
ISBN:
9781319013387
Author:
David S. Moore, George P. McCabe, Bruce A. Craig
Publisher:
W. H. Freeman