A certain type of candy is reported to be distributed with the color percentages shown in the table below. The number of each color in a random bag of candy is also shown below. Use the chi-square goodness-of-fit test to decide whether the color distribution differs from the reported distribution. Use a = 0.05. Color Percentage Frequency Green 15 20 Determine the null and alternative hypotheses. Choose the correct answer below. OA. Ho: The color distribution is the same as that reported. Ha: The color distribution is different from that reported. OB. Ho: The frequency is the same for each color. Ha: The frequency is different for each color. OC. Ho: The color distribution is different from that reported. Ha: The color distribution is the same as that reported. Orange 21 26 OD. Ho: The frequency is different for each color. Ha: The frequency is the same for each color. Yellow 13 7 Blue 25 29 Red 14 16 Brown 12 10 D
A certain type of candy is reported to be distributed with the color percentages shown in the table below. The number of each color in a random bag of candy is also shown below. Use the chi-square goodness-of-fit test to decide whether the color distribution differs from the reported distribution. Use a = 0.05. Color Percentage Frequency Green 15 20 Determine the null and alternative hypotheses. Choose the correct answer below. OA. Ho: The color distribution is the same as that reported. Ha: The color distribution is different from that reported. OB. Ho: The frequency is the same for each color. Ha: The frequency is different for each color. OC. Ho: The color distribution is different from that reported. Ha: The color distribution is the same as that reported. Orange 21 26 OD. Ho: The frequency is different for each color. Ha: The frequency is the same for each color. Yellow 13 7 Blue 25 29 Red 14 16 Brown 12 10 D

MATLAB: An Introduction with Applications
6th Edition
ISBN:9781119256830
Author:Amos Gilat
Publisher:Amos Gilat
Chapter1: Starting With Matlab
Section: Chapter Questions
Problem 1P

Related questions
Question
100%
Compute the value of test statistic x^2
Identify the critical value
Does the data provide sufficient evidence that the distribution of the variable differs from the given distribution?
all answers in 3 decimal places. Thanks
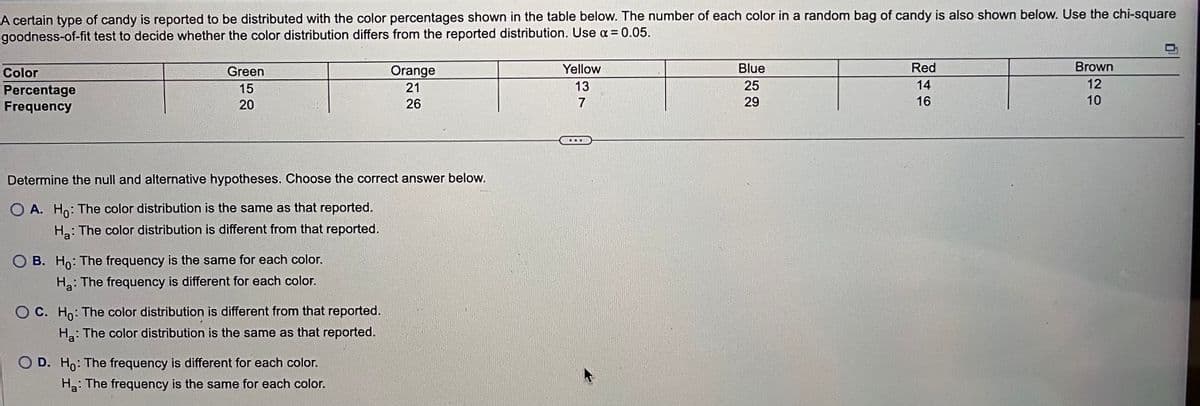
Transcribed Image Text:A certain type of candy is reported to be distributed with the color percentages shown in the table below. The number of each color in a random bag of candy is also shown below. Use the chi-square
goodness-of-fit test to decide whether the color distribution differs from the reported distribution. Use α = 0.05.
Color
Percentage
Frequency
Green
15
20
Determine the null and alternative hypotheses. Choose the correct answer below.
O A. Ho: The color distribution is the same as that reported.
H₂: The color distribution is different from that reported.
OB. Ho: The frequency is the same for each color.
Ha: The frequency is different for each color.
OC. Ho: The color distribution is different from that reported.
H₂: The color distribution is the same as that reported.
Orange
21
26
O D. Ho: The frequency is different for each color.
Ha: The frequency is the same for each color.
Yellow
13
7
Blue
25
29
Red
14
16
Brown
12
10
Expert Solution
This question has been solved!
Explore an expertly crafted, step-by-step solution for a thorough understanding of key concepts.

This is a popular solution!

Trending now
This is a popular solution!

Step by step
Solved in 6 steps with 1 images

Recommended textbooks for you
MATLAB: An Introduction with Applications
Statistics
ISBN:
9781119256830
Author:
Amos Gilat
Publisher:
John Wiley & Sons Inc

Probability and Statistics for Engineering and th…
Statistics
ISBN:
9781305251809
Author:
Jay L. Devore
Publisher:
Cengage Learning

Statistics for The Behavioral Sciences (MindTap C…
Statistics
ISBN:
9781305504912
Author:
Frederick J Gravetter, Larry B. Wallnau
Publisher:
Cengage Learning
MATLAB: An Introduction with Applications
Statistics
ISBN:
9781119256830
Author:
Amos Gilat
Publisher:
John Wiley & Sons Inc
Probability and Statistics for Engineering and th…
Statistics
ISBN:
9781305251809
Author:
Jay L. Devore
Publisher:
Cengage Learning
Statistics for The Behavioral Sciences (MindTap C…
Statistics
ISBN:
9781305504912
Author:
Frederick J Gravetter, Larry B. Wallnau
Publisher:
Cengage Learning

Elementary Statistics: Picturing the World (7th E…
Statistics
ISBN:
9780134683416
Author:
Ron Larson, Betsy Farber
Publisher:
PEARSON

The Basic Practice of Statistics
Statistics
ISBN:
9781319042578
Author:
David S. Moore, William I. Notz, Michael A. Fligner
Publisher:
W. H. Freeman

Introduction to the Practice of Statistics
Statistics
ISBN:
9781319013387
Author:
David S. Moore, George P. McCabe, Bruce A. Craig
Publisher:
W. H. Freeman