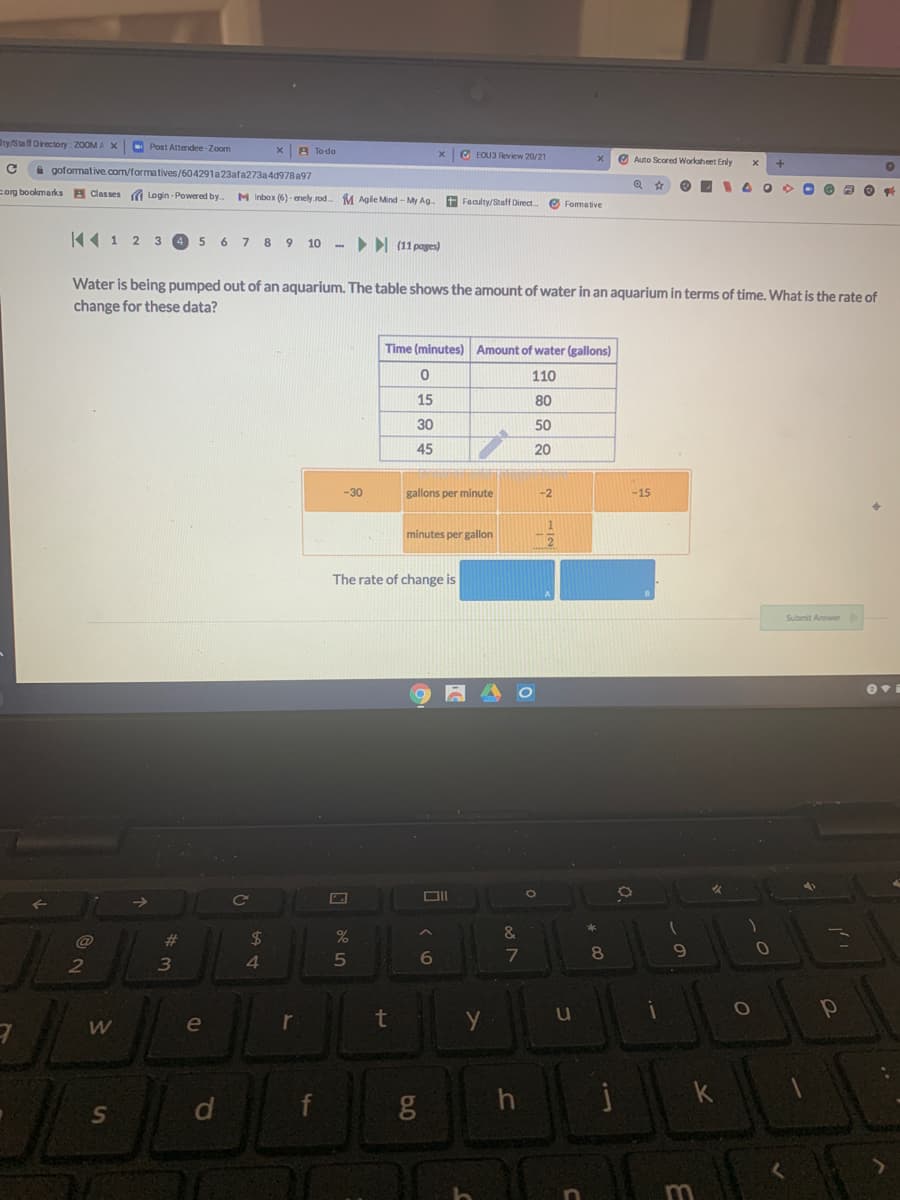
A Classes a Login-Powered by- M Inbox (6) - enely rod. M Agle Mind - My Ag. Fealty/taff Direct Formative K4 1 2 3 45 6 7 8 9 10 > (11 payes) Water is being pumped out of an aquarium. The table shows the amount of water in an aquarium in terms of time. What is the rate of change for these data? Time (minutes) Amount of water (gallons) 110 15 80 30 50 45 20 -30 gallons per minute -2 -15 minutes per gallon The rate of change is Submit Anwer 12


Q: E. coli population A common inhabitant of human intestines is the bacterium Escherichia coli. A…
A: “Since you have posted a question with multiple sub-parts, we will solve first three sub-parts for…
Q: 28. Income Elasticity of Demand: Broadband in 2007 The following graph shows the percentage q of…
A: To find the equation
Q: A dairy company's records reveal that it costs approximately C(w) = 3750.24 + 74.96 ln w dollars…
A: Quadratic model =>w(t)=at^2+bt+c
Q: A student asks his mother for an upgrade for his phone, claiming the battery no longer holds an…
A:
Q: The lifespan of a refrigerator made by General Electric (GE) costing $1930 has a mean life of 3.03…
A:
Q: opulation growth models are given for countries based on the World Health Organization’s 2006 World.…
A: Given that: R(t)=9.038(1.05)t H(t)=10.098(0.998)t NOTE: As per our answering guidelines, we can…
Q: Life expectancy is the key metric for assessing population health. The following graph shows the…
A: Given, U(t) represents the life expectancy in the united states and A(t) represents the life…
Q: The manager of Collins Import Autos believes the number of cars sold in a day (Q) depends on two…
A: a) The model is, Q=a H b S c Taking log on both sides, LN(Q)=LN(a)+b LN(H)+c LN(S) Q*=a*+b H*+c S*…
Q: hp Suppose 23 blackberry plants started growing in a yard. Absent constraint, the blackberry plants…
A: 23 blackberry plants started growing in a yard. The blackberry plants will spread by 100% a month…
Q: The numbers of polio cases in the world are shown in the table for various years. Year Number of…
A:
Q: 1. This table shows the number of swimmers in the ocean at a given time. Find the rate of change for…
A:
Q: The numbers of polio cases in the world are shown in the table for various years. Year Number of…
A: Create the table of t and f(t). t f(t) 8 350 12 138…
Q: The numbers of polio cases in the world are shown in the table for various years. Year Number of…
A: The general exponential equation is represented by the equation: y=abx. Here, x is the independent…
Q: 3. An investment account earns 6.4% interest compounded yearly. The beginning balance was $3550. Let…
A: Given principal amount (P)=3550, Rate of Interest (r)=6.4=6.4/100=0.064 Time(Number of years)=t
Q: 1. This table shows the number of swimmers in the ocean at a given time. Find the rate of change for…
A:
Q: DETAILS A breeding group of foxes is introduced into a protected area, and the population growth…
A: Given that N=47.5/(0.25+0.76^t) To find the following
Q: The data in the table below show the percent of miscarriages, by age. a. Create a scatter plot for…
A:
Q: In growth of human population if a is the birth rate and B is dead rate where t is time & No The…
A:
Q: he average enrollment E at a nearby school t years after 2015 is given by the pllowing table. 1 E…
A: Detrmine the decrease percentage
Q: what are the blanks
A: It is given that additional of 1 worker increases production by 0.12.55 workers is a 5 worker…
Q: The demand for a 12-ounce bottle of sparkling water is given in the table. Demand Schedule for…
A:
Q: A family on a University campus has a 150-gallon tank that is filled at the beginning of each week.…
A: \ Here, the random variable X denotes the weekly demand in hundred of gallons.
Q: 1. Kandeer measures the amount of water in his backyard well each day during a dry spell in his…
A: In this question we have to find the rate of change of amount of water with respect to number of…
Q: A common inhabitant of human intestines is the bacterium Escherichia coli. A cell of this bacterium…
A:
Q: (a) Fill in the table to find the average rate of change and the percentage rate of change between…
A: We have to find the average rate of change and the percentage rate of change between successive data…
Q: X represents the number of days after March 2020 Y represents the total flu cases (thousands) X…
A: Hello thanks for your question. Since you have posted a question with multiple sub-parts, we will…
Q: When a bactericide was added to a nutrient broth in which bacteria were growing, the bacterium…
A:
Q: A common inhabitant of human intestines is the bacterium Escherichia coli. A cell of this bacterium…
A: Since you have posted a question with multiple sub-parts, we will solve first three sub-parts for…
Q: We model the salary of the average inhabitant of Pinkland. Salaries are a function of education…
A: Given the estimated model as…
Q: The data in the table below shows the intensity and loudness level of variaous sounds a. Create a…
A: The objective is to create scatter plot of data and whether an exponential function, a logarithmic…
Q: Oil production P(t) 3.2 A 3.1 2.94 2.9 2.8 8. 10 11 12 13 Time (years since 2000) Millions of…
A: Definition used - The slope of a line passing through two points (x1, y1) &…
Q: cash flow at the oil company is continuously reinvested. An investment in a new data logging system…
A: The effective interest rate when interest is compounded continuously is given by i = er-1 where i is…
Q: The numbers of polio cases in the world are shown in the table for various years. Year Number of…
A: Consider the provided question, Let f(t) be the number of polio cases in thousands t years since…
Q: Sexually Active Girls The percent of girls betweenages 15 and 20 who have been sexually active…
A: “Since you have posted a question with multiple sub-parts, we will solve the first three subparts…
Q: 18. The table below shows the federal minimum wage in different years. Year 1960 1970 1980 1990 2000…
A: Given: The table below shows the federal minimum wage in different years. year 1960 1970 1980…
Q: The quantity Q(t) of a drug in the bloodstream, in mg, at hour t, decays exponentially, as given in…
A: Since we only answer up to 3 sub-parts, we’ll answer the first 3. Please resubmit the question and…
Q: The graph models the amount of radioactive elenent present over the course of a 10-minute…
A: The average rate of change of a function fx in the interval x1,x2 is calculated as follows:
Q: This graph shows the monthly attendance at a theatre over several years. Theatre Attendance (1000)…
A:
Q: A student is trying to determine the doubling time for a population of the bacterium Giardia lamblia…
A: Given, A student is trying to determine the doubling time for a population of the bacterium…
Q: 9. Cell Phones The following table shows the num- ber, in millions, of cell phone subscribers in the…
A: Image is attached with detailed solution.
Q: The table shows the value of money in an investment. Years Since Value in the Opening the Account…
A: The table of the value of money in an investment is given as Years since opening the account…
Q: In 1997, 1500 runners entered a marathon in Joppetown U.S.A. In 2003, 18,000 runners entered the…
A: Since you have posted a question with multiple sub-parts, we will solve first three subparts for…
Q: What type of function represent the data table? -1 16 2. -2 3. 20 46 O a Linear O b Quadratic Cubic…
A:
Q: A common inhabitant of human intestines is the bacterium Escherichia coli. A cell of this bacterium…
A: SOLUTION-
Q: Age Cumulative Percent Sexually Active Girls 5.7 The percents of girls age x or younger who have…
A: Hey, since there are multiple sub-parts posted, we will answer the first 3 sub-parts. If you want…
Q: Provide an appropriate response. 10) 10) If a population has exceeded the carrying capacity of its…
A: 10. C.
Q: A nation's population (to the nearest million) was 281 million in 2000 and 311 in 2010. It is…
A: Solve for given conditions
Q: The graph shows the amount of a medicine m, in milligrams, remaining in a patient's body h hours…
A:
Q: a. Use the values values of Y for the next two months, using simple exponential smoothing with w =…
A: Exponential smoothing is used to smooth out the time-series data. It assigns weights exponentially…


Trending now
This is a popular solution!

Step by step
Solved in 2 steps with 2 images


- A food bank investigates if the number of times their donors walk by a homeless person each week impacts donors’ charitable contribution to the food bank. The data are presented below in standard form. # of homeless people seen each week Donation to food bank Donor ZX ZY 1 -1.3 0.36 2 0.64 -0.09 3 -1.1 1.26 4 -0.14 0.14 5 1.41 -0.54 6 -0.52 -0.09 7 1.03 -1.9 8 0.64 -0.99 9 0.83 0.36 10 -1.49 1.49 What does ΣZXZY equal? A) 941B) 7.86C) -7.16D) -4.44 What is the correlation (Pearson’s r) between the number of homeless people donors see each week and their donation to the food bank (rounded to 2 decimal places)? A) .98B) -.80C) .72D) -.56 What is the obtained t-value for this r? A) -2.96B) -16.35C) -3.72D) -1.89 What are the degrees of freedom? A) 4B) 20C) 8D) 10 What is the critical t-value? A) 3.68B) 2.31C) 2.01D) 3.30 What is your conclusion? A) There is…A food bank investigates if the number of times their donors walk by a homeless person each week impacts donors’ charitable contribution to the food bank. The data are presented below in standard form. # of homeless people seen each week Donation to food bank Donor ZX ZY 1 -1.3 0.36 2 0.64 -0.09 3 -1.1 1.26 4 -0.14 0.14 5 1.41 -0.54 6 -0.52 -0.09 7 1.03 -1.9 8 0.64 -0.99 9 0.83 0.36 10 -1.49 1.49 What does ΣZXZY equal? A) 941B) 7.86C) -7.16D) -4.44 What is the correlation (Pearson’s r) between the number of homeless people donors see each week and their donation to the food bank (rounded to 2 decimal places)? A) .98B) -.80C) .72D) -.56 What is the obtained t-value for this r? A) -2.96B) -16.35C) -3.72D) -1.89Some studies have shown that in the United States, men spend more than women buying gifts and cards on Valentine’s Day. Suppose a researcher wants to test this hypothesis by randomly sampling nine men and 10 women with comparable demographic characteristics from various large cities across the United States to be in a study. Each study participant is asked to keep a log beginning one month before Valentine’s Day and record all purchases made for Valentine’s Day during that one[1]month period. The resulting data are shown below. Use these data and a 1% level of significance to test to determine if, on average, men actually do spend significantly more than women on Valentine’s Day. Assume that such spending is normally distributed in the population and that the population variances are equal.
- Clocking the Cheetah. The cheetah (Acinonyx jubatus) is the fastest land mammal and is highly specialized to run down prey. The cheetah often exceeds speeds of 60 mph and, according to the online document “Cheetah Conservation in Southern Africa” (Trade&Environment Database (TED) Case Studies, Vol. 8, No. 2) by J. Urbaniak, the cheetah is capable of speeds up to 72 mph. Following is a frequency histogram for the speeds, in miles per hour, for a sample of 35 cheetahs.Fruit flies have built-in circadian rhythms that keep time in the absence of external stimuli. Several genes have been shown to be involved in internal timekeeping, including per (period) and tim (timeless). Mutations in these two genes, and in other genes, disrupt timekeeping abilities. Interestingly, these genes have also been shown to be involved in other time-related behavior. Individuals that carry particular mutations of per and tim have been shown to copulate for longer than individuals that have neither mutation. The following table summarizes some data on the duration of copulation for flies that carry either the per mutation or the tim mutation: Mutation Mean copulation duration (min) Standard deviation Sample size per 17.5 3.37 14 tim 19.9 2.47 17 Do the populations carrying these mutations have different variances in copulation durations? Carry out the appropriate test using α =0:05 Do these two mutations lead to different mean…You are a consultant to EAI and you have received the data on theannual salaries of 2500 managers. Some of these managers have alsoindicated that they have received some training. Conduct theappropriate descriptive analyses and present a report that willenable EAI to understand its operations. The link to the data is: https://drive.google.com/file/d/1KluyxHQdEsVNA38_EWPcEgKUJomm9b67/view
- The output of a solar panel (photovoltaic) system depends on its size. A manufacturer states that the average daily production of its 1.5 kW system is 6.6 kilowatt hours (kWh) for Perth conditions. A consumer group monitored this 1.5 kW system in 20 different Perth homes and measured the average daily production by the systems in these homes over a one month period during October. The data is provided here. kWh 6.2, 5.8, 5.9, 6.1, 6.4, 6.3, 6.9, 5.5, 7.4, 6.7, 6.3, 6.2, 7.1, 6.8, 5.9, 5.4, 7.2, 6.7, 5.8, 6.9 1. Analyse the consumer group’s data to test if the manufacturer’s claim of an average of 6.6 kWh per day is reasonable. State appropriate hypotheses, assumptions and decision rule at α = 0.10. What conclusions would you report to the consumer group? (Hint: You will need to find Descriptive Statistics first.) 2. If 48 homes in the central Australian city of Alice Springs had this system installed and similar data was collected, in order to assess whether average daily production in…In a study, the effects of the mane of a male lion as a signal of quality to mates and rivals was explored. Four life-sized dummies of male lions provided a tool for testing female response to the unfamiliar lions whose manes varied by length (long or short) and color (blonde or dark). The female lions were observed to see whether they approached each of the four life-sized dummies. Complete parts (a) through (e) below. a. Identify the experimental units. Choose the correct answer below. The female lions The male dummies The mane colors The mane lengths Part 2 b. Identify the response variable. Choose the correct answer below. A. Whether or not (yes or no) the mane length affected how the female lions reacted to a male dummy. B. Whether or not (yes or no) the female lions approached the same dummies. C. Whether or not (yes or no) the female lions approached a male dummy. D. Whether or not…The table gives the first 5 observations of 4242 years of data on boats registered in Florida and manatees killed by boats. Year Boats Manatees 1977 447 13 1978 460 21 1979 481 24 1980 498 16 1981 513 24 1982 512 20 Click to download the data in your preferred format to view the full data. CSV Excel JMP Mac-Text Minitab14-18 Minitab18+ PC-Text R SPSS TI CrunchIt! The scatterplot of this data shows a strong positive linear relationship. The correlation is ?=0.919. (b) Suppose we expect that the number of boats registered in Florida to be 950,000 in 2019. What would you predict the number of manatees killed by boats to be if there are 950,000 boats registered? Give your answer to a whole number. ?̂ = manatee deaths Select the statements that explain why we can trust this prediction. The prediction is reliable because of the strong linear association visible in the scatterplot. The…
- Identical twins come from a single egg that split into two embryos, and fraternal twins are from separate fertilized eggs. Also, identical twins must be of the same sex and the sexes are equally likely, and sexes of fraternal twins are equally likely. Use the data table to complete parts (a) and (b) below. boy/boy boy/girl girl/boy girl/girl Identical twins 1 0 0 1 Fraternal twins 10 10 10 10 a. After having a sonogram, a pregnant woman learns that she will have twins. What is the probability that she will have identical twins? b. After studying the sonogram more closely, the physician tells the pregnant woman that she will give birth to twin boys. What is the probability that she will have identical twins? That is, find the probability of identical twins given that the twins consist of two boys.Is the magnitude of an earthquake related to the depth below the surface at which the quake occurs? Let x be the magnitude of an earthquake (on the Richter scale), and let y be the depth (in kilometers) of the quake below the surface at the epicenter. x 2.8 3.9 3.3 4.5 2.6 3.2 3.4y 4.7 9.6 11.2 10.0 7.9 3.9 5.5(a) Make a scatter diagram of the data.Flash Player version 10 or higher is required for this question. You can get Flash Player free from Adobe's website. Then visualize the line you think best fits the data. (b) Use a calculator to verify that Σx = 23.7, Σx2 = 82.75, Σy = 52.8, Σy2 = 447.56 and Σxy = 184.28. Compute r. (Round to 3 decimal places.) As x increases, does the value of r imply that y should tend to increase or decrease? Explain your answer.Given our value of r, we can not draw any conclusions for the behavior of y as x increases.Given our value of r, y should tend to remain constant as x increases. Given our value of r, y should tend to decrease as x increases.Given…Consider a simple model to explain a country’s alcohol related automobiles incidents (totaai) in terms of police police officers (topps): Estimating (a) using quarterly data from 1991-2024 gives: log(totaait) = 12.58 − 0.66 log(topps); (2.22) (0.33) n = 95; R2 = :439; 2. Test the null hypothesis that the coefficient on the log(topps) has no effect on the log(totaait) at the 5% level. 3. Suppose that both total alcohol incidents (totaai) and total police officers (totts) have a positive trend. Given this information, discuss whether the OLS estimates of ˛1 from equation (a) is unbiased (i.e., E(˛ˆ 1) = ˛1)?
