A coin is tossed at the same time with a die. What is the probability of getting a head and a 5? A. 1/3 В. 1/12 С. 1/26 D. 1/24
A coin is tossed at the same time with a die. What is the probability of getting a head and a 5? A. 1/3 В. 1/12 С. 1/26 D. 1/24

College Algebra (MindTap Course List)
12th Edition
ISBN:9781305652231
Author:R. David Gustafson, Jeff Hughes
Publisher:R. David Gustafson, Jeff Hughes
Chapter8: Sequences, Series, And Probability
Section8.7: Probability
Problem 19E: If the spinner shown below is spun, find the probability of each event. Assume that the spinner...

Related questions
Question
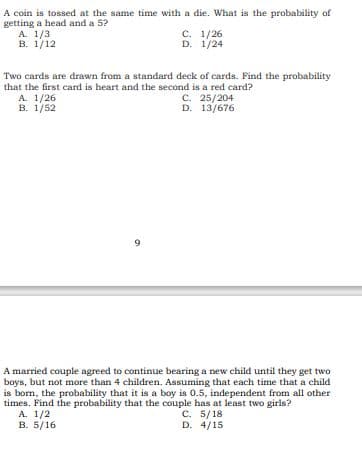
Transcribed Image Text:A coin is tossed at the same time with a die. What is the probability of
getting a head and a 5?
А. 1/3
В. 1/12
C. 1/26
D. 1/24
Two cards are drawn from a standard deck of cards. Find the probability
that the first card is heart and the second is a red card?
C. 25/204
D. 13/676
A. 1/26
A married couple agreed to continue bearing a new child until they get two
boys, but not more than 4 children. Assuming that each time that a child
is born, the probability that it is a boy is 0.5, independent from all other
times. Find the probability that the couple has at least two girls?
А. 1/2
B. 5/16
с. 5/18
D. 4/15
Expert Solution
This question has been solved!
Explore an expertly crafted, step-by-step solution for a thorough understanding of key concepts.

Step by step
Solved in 2 steps

Recommended textbooks for you
College Algebra (MindTap Course List)
Algebra
ISBN:
9781305652231
Author:
R. David Gustafson, Jeff Hughes
Publisher:
Cengage Learning
College Algebra (MindTap Course List)
Algebra
ISBN:
9781305652231
Author:
R. David Gustafson, Jeff Hughes
Publisher:
Cengage Learning