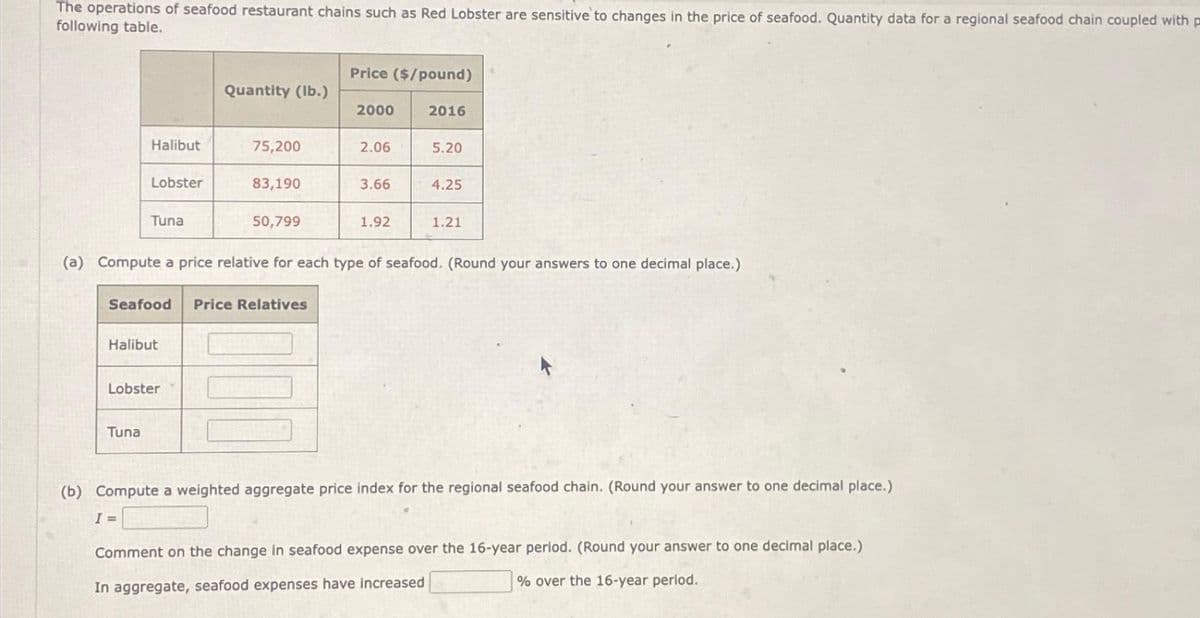
(a) Compute a price relative for each type of seafood. (Round your answers to one decimal place.). Seafood Price Relatives Halibut Lobster Tuna (b) Compute a weighted aggregate price index for the regional seafood chain. (Round your answer to one decimal place.). I = Comment on the change in seafood expense over the 16-year period. (Round your answer to one decimal place.) In aggregate, seafood expenses have increased % over the 16-year period.


Q: Use the t-distribution to find a confidence interval for a mean given the relevant sample results.…
A: From the provided information,Confidence level = 99%
Q: Two samples are taken with the following sample means, sizes, and standard deviations 1372 = 40 = 50…
A: The objective of this question is to estimate the difference in population means using a 91%…
Q: Fill in the table below (last row is for sums) I 2 y 3 2 x y² xy
A: From the given information, xyx^2y^2xy234962441682542510
Q: In 2003, an organization surveyed 1,500 adult Americans and asked about a certain war, "Do you…
A: From the provided information,Confidence level = 90%
Q: Find the critical value t(subscript)c for the confidence level c = 0.90 and sample size n = 24
A: The confidence level: Sample size:
Q: ollowing July 31 because that was the age cutoff date for nonschool baseball leagues. The table…
A: The question is about categorical data analysis.Given :To find :Test the give claim.
Q: Determine the sampling error if the grade point averages for 10 randomly selected students from a…
A: The provided information is as follows:The grade point averages for 10 randomly selected students…
Q: The table shown displays the classification of 240 movies according to genre. Which measure of…
A: GenreNumber of moviesAction/adventure33Drama16Comedy/romantic…
Q: ufacturer knows that the number of items produced per hour by machine A and by machine B are…
A: Sample sizes n1=57,n2=47Sample means x1=229 ,x2=215
Q: How many ways are there to form a subset of [n] of size k with the property that each selected…
A: We are asked to find in how many ways we can pick a group of numbers from the set of numbers such…
Q: Many track hurdlers believe that they have a better chance of winning if they start in the inside…
A: The claim is that the probabilities of winning are the same in the different positions.
Q: 2.89 Random variables X and Y follow a joint distribution 0 1 0 2 0 x 1 2 3 70 9 70 2 18 18 70 70 70…
A: Solution-:We have given the following table:…
Q: 4. Construct the 95% confidence interval for ₁ - 2, the average score difference between group A and…
A: Since you have posted a question with multiple subparts, we will provide a solution to the first…
Q: A well-known brokerage firm executive claimed that 30% of investors are currently confident of…
A: The question is about hypothesis testing.Given :Population proportion of investors are currently…
Q: 6) Here is a list of numbers written in order of size. 3 6 ху The numbers have a median of 8 have a…
A: Given ordered numbers are:3,6,x,yMedian =8Mean=11
Q: In Pacman game, Pacman has to traverse space and eat all the available food pellets without being…
A: For a Pacman game, Pacman has to traverse space and eat all the available food pellets without being…
Q: (d) List the confidence interval. (e) Interpret the confidence interval.
A: The formula for the confidence interval is,
Q: RightAid Inc. operates a regional chain of 120 pharmacies. Each pharmacy's floor plan includes a…
A: From the information, given that
Q: The bond behavior of inforcing bars is an important determina strength and stability. The article…
A: b)In this case, the independent variable is lateral pressure (x) and the dependent variable is bond…
Q: A convenience store recently started to carry a new brand of soft drink. Management is interested in…
A: The question is about forecasting.Given :To find :i ) Forecast for week 13 using trend projection.…
Q: A random sample of 64 students at a university showed an average age of 25 years and a sample…
A: Let be the population mean age of all students in the university.Given that,Sample size Average age…
Q: let E = Ea x Eb be a compound experiment. If Ea and Eb are statistitacally independent than for any…
A: Statistically independent events are events in probability theory where the occurrence or…
Q: X Y 2 30 6 40 7 10 Calculate the coefficient of correlation of X and Y about -37%…
A: xy230640710
Q: Based on the data shown below, calculate the regression line (each value to two decimal places) y =…
A: We are given data and asked to calculate the regression line based on the data.…
Q: 6.6 Consider the following items to be stored in a unit load (pallet) stor- age area, stacked…
A: 1. Dedicated Storage: Each item will have a dedicated number of pallets. The number of pallets for…
Q: A student wants to see if the correct answers to multiple choice problems are evenly distributed.…
A: We have given informationIn a sample, their are multiple choice questions, and each question has…
Q: Consider the ANOVA table shown here for a one-way analysis of variance for an experimental design in…
A: The incomplete ANOVA table for four treatment levels is given…
Q: Ages Number of students 15-18 19-22 23-26 27-30 9 8 00 4 7 6 Relative Frequency 96 96 96 96 96 31-34…
A: we know the following data,Agesnumber of students15-18919-22823-26427-30731-34635-387
Q: In this problem, assume that the distribution of differences is approximately normal. Note: For…
A: There are two dependent samples which are January and April.We have to test whether the peak wind…
Q: Choose the best conclusion for a test of significance using significance level based on the given…
A: Let h1 and h2 be the two population means.Given that,P-value = 0.0123Assume the level of…
Q: The incomes of a group of 10,000 persons were found to be normally distributed with mean equal to…
A: Given that, the income of the group is normally distributed.Total number of people: Mean: Standard…
Q: Looking at this output in the photo, we know that the proportion of the variation in mileage is…
A: In a given situation,Dependent variable: mileage of a carIndependent variable: weight of a car
Q: An epidemiologist plans to conduct a survey to estimate the percentage of women who give birth. How…
A: The margin of error = 1% = 1/100 = 0.01Confidence interval = 90% α = 1-0.90 = 0.10α/2 = 0.10/2 =…
Q: Engineers aim to analyze the impact of polypropylene fibers on the compressive strength of concrete.…
A: Given the data and want to calculate the ratio of MS treatment and MSE
Q: Two electric generators are connected in series to supply electricity for a company during network…
A: The 2 electric generators are connected in series to supply electricity for the company during…
Q: Find the cumulative distribution function (C.D.F) of a random variable Y, whose probability density…
A: The probabiilty density function of Y is,
Q: A police station had to deploy a police officer for an emergency multiple times in the last four…
A: "Forecast for tomorrow" using exponential smoothing forecasting approach.Given values:Smoothing…
Q: Put data in a graph like the graph in the example photo. What's the percentages of kids watching tv…
A: Given the data asNameAgeHours Time watching T.VKid 1139Kid 2157Kid 3184Kid 4169Kid 5178Kid 6174Kid…
Q: A laboratory in California is interested in finding the mean chloride level for a healthy resident…
A: Sample size The mean Chloride level is =105 mEq/LPopulation standard deviation is 38 mEq/LThe…
Q: Students taking the Graduate Management Admissions Test (GMAT) were asked about their undergraduate…
A: Since you have posted a question with multiple sub-parts, we will solve first three sub-parts for…
Q: Consider the following function given below with a specified range for the variable t, where t…
A: Given, the probability density function of the time required to clear a minor traffic accident on a…
Q: To test whether the mean time needed to mix a batch of material is the same for machines produced by…
A: Null hypothesis: There is no evidence to conclude that population mean times for mixing a batch of…
Q: 2. A clinician looked at the effect of position on blood pressure levels. Ten participants had their…
A: The data for systolic and diastolic blood pressure values recorded for each patient in both…
Q: An article included data from a survey of a random sample of adults living in the United States. Of…
A: n=sample size=1300 X=700
Q: Suppose Sn is the sum of 48 independent experimental values of the random variable X whose…
A: Given thatConsider,
Q: You wish to test the following claim (Ha) at a significance problem, H = PostTest - PreTest where…
A: Null Hypothesis Alternative Hypothesis where, Significance level
Q: Let X ∼ Gamma(α, β) for α > 1. Find E{1/X}. How does this compare with 1/EX?
A: Given that the random variable follows a Gamma distribution with parameter and .Its probability…
Q: Suppose that for a recent admissions class, an Ivy League college received 2,825 applications for…
A: The probability shows how likely an event occurs.
Q: The table summarizes results from pedestrian deaths that were caused by automobile accidents.…
A: From the provided information,Total pedestrian deaths = 50+71+251+603 = 975Number of deaths in which…
Q: A researcher was investigating variables that might be associated with the academic performance of…
A: Given that,
4

Step by step
Solved in 3 steps with 33 images

- Aragon Equipment, Inc. is a tractor manufacturer that is beginning to realize the importance of sales data in marketing its products. Its two main products are The Incisor, a tractor used in large agricultural settings, and The Caddy, a smaller tractor primarily used in landscape. The company divides its market into four geographic regions. With the aim of maximally allocating its resources, Aragon decides to investigate whether there is a relationship between the variables type of Aragon tractor sold ("The Incisor" or "The Caddy") and geographic region of the sale ("Great Lakes", "Ohio Valley", "Mid-Atlantic", or "Corn Belt"). The contingency table below summarizes sales data from 500 Aragon tractor sales. Each cell of the table contains three numbers: the first number is the observed cell frequency (fO); the second number is the expected cell frequency (fE) under the assumption that there is no relationship between the type of tractor sold and the geographic region of the sale; and…The regional transit authority for a major metropolitan area wants to determine whether there is any relationship between the age of a bus and the annual maintenance cost. A sample of 10 buses resulted in the data in Worksheet 2. Worksheet 2 Age of a Bus (years) Maintenance Cost ($) 1 350 2 370 2 480 2 520 2 590 3 550 4 750 4 800 5 790 5 950 At the 0.05 level of significance, is there evidence of a linear relationship between the age of a bus and the annual maintenance cost.Burger Dome sells hamburgers, cheeseburgers, French fries, soft drinks, and milk shakes, as well as a limited number of specialty items and dessert selections. Although Burger Dome would like to serve each customer immediately, at times more customers arrive than can be handled by the Burger Dome food service staff. Thus, customers wait in line to place and receive their orders. Suppose that Burger Dome analyzed data on customer arrivals and concluded that the arrival rate is 45 customers per hour and 1 customer processed per minute. Compare a multiple-server waiting line system with a shared queue to a multiple-server waiting line system with a dedicated queue for each server. Suppose Burger Dome establishes two servers but arranges the restaurant layout so that an arriving customer must decide which server's queue to join. Assume that this system equally splits the customer arrivals so that each server sees half of the customers. How does this system compare with the two-server…
- A researcher is interested in examining the relationship between ACT scores and college GPA. What can youconclude from the following data? Based on the interpretation framework discussed in class, how strong is thiscorrelation? Discuss the relative movement of the variables Participant ACT GPA1 24 2.752 28 3.253 29 3.504 35 3.755 34 4.006 30 3.807 29 2.608 27 2.689 31 3.36Chad Dobson is considering real estate investment near a community college. The accompanying data file includes monthly rents (in $) for 27 houses, along with three characteristics of the home: number of bedrooms (Beds), number of bathrooms (Baths), and square footage (Sqft). Rent Beds Baths Sqft 2950 4 4 1453 2400 4 2 1476 2375 3 3 1132 2375 3 3 1132 2350 4 2.5 1589 2000 3 2.5 1459 1935 3 2 1200 1825 3 2 1248 1810 2 2 898 1735 3 2.5 1060 1695 3 2 1100 1405 3 1 1030 1375 2 1 924 1365 2 1 974 1325 2 2 988 1275 2 2 880 1200 1 1 712 1180 2 1.5 890 1180 2 2 960 1115 2 1 1020 1100 2 1 903 1060 1 1 724 1007 3 2 1260 850 2 1.5 890 810 1 1 570 785 1 1 475 744 2 1 930 1. Estimate the linear model that uses Rent as the response variable. Note: Negative values should be indicated by a minus sign. Round your answers to 2 decimal places. 2. Estimate the exponential model that uses log of Rent as the response variable. Note: Negative…Organizations such as J.D. Power and Associates use the proportion of owners likely to repurchase a particular automobile as an indication of customer loyalty for the automobile. An automobile with a greater proportion of owners likely to repurchase is concluded to have greater customer loyalty. A study was conducted to compare the customer loyalty for three automobiles: Chevrolet Impala, Ford Fusion, and Honda Accord. The study contained 500 respondents and the data is summarized in the Microsoft Excel Online file below. Use the spreadsheet to perform the required calculations and hypothesis test.
- A dietetics student wanted to look at the relationship between calcium intake and knowledge about calcium in sports science students. Table 1 shows the data she collected. Respondent number Knowledge score (Out of 50) Calcium intake (mg/day) Respondent number Knowledge score (Out of 50) Calcium intake (mg/day) 1 10 450 11 38 940 2 42 1050 12 25 733 3 38 900 13 48 985 4 15 525 14 28 763 5 22 710 15 22 583 6 32 854 16 45 850 7 40 800 17 18 798 8 14 493 18 24 754 9 26 730 19 30 805 10 32 894 20 43 1085 Does knowledge score predicts the calcium intake of a person?To find hypothesis testing, determine: 1. Null and Alternative Hypothesis 2. Sample size and Alpha Level 3. Find the statistical tool 4. Computation 5. Decision 6. ConclusionA dietetics student wanted to look at the relationship between calcium intake and knowledge about calcium in sports science students. Table 1 shows the data she collected. Respondent number Knowledge score (Out of 50) Calcium intake (mg/day) Respondent number Knowledge score (Out of 50) Calcium intake (mg/day) 1 10 450 11 38 940 2 42 1050 12 25 733 3 38 900 13 48 985 4 15 525 14 28 763 5 22 710 15 22 583 6 32 854 16 45 850 7 40 800 17 18 798 8 14 493 18 24 754 9 26 730 19 30 805 10 32 894 20 43 1085 Is there a relationship between calcium intake and knowledge about calcium in sports science students? Use ANOVA Test to determine the answers.A dietetics student wanted to look at the relationship between calcium intake and knowledge about calcium in sports science students. Table 1 shows the data she collected. Respondent number Knowledge score (Out of 50) Calcium intake (mg/day) Respondent number Knowledge score (Out of 50) Calcium intake (mg/day) 1 10 450 11 38 940 2 42 1050 12 25 733 3 38 900 13 48 985 4 15 525 14 28 763 5 22 710 15 22 583 6 32 854 16 45 850 7 40 800 17 18 798 8 14 493 18 24 754 9 26 730 19 30 805 10 32 894 20 43 1085 Does knowledge score predicts the calcium intake of a person?
- The dataset below was collected from a survey to determine whether CFT development in the island can be used as a strategy for the sustainable management and utilization of the fishery and aquatic resources in small islands. It shows the monthly income (in thousand pesos) estimated by 200 randomly selected fishers in Guimaras according to the type of fishers (i.e., the income source of fishers is solely fishing or they have alternative/supplemental livelihood such as island hopping services, sari-sari store ownership, fish value adding and/or vending, souvenir selling, carpentry, as construction worker, farming and tour guiding) and their perceived benefit from CFT development in the island. From this dataset and using = 0.05, is there a significant difference in estimated monthly income due tofisher type? How about due to the CFT perceived benefit? How about due to the interaction between fishertype and the perceived CFT benefit?a. Analyze manually and assume that the…McAllister, et al. (2012) compared varsity football and hockey players with varsity athletes from noncontact sports to determine whether exposure to head impacts during one season have an effect on cognitive performance. In the study, tests of new learning performance were significantly poorer for the contact sport athletes compared to the noncontact sport athletes. The following table presents data similar to the results obtained in the study. Noncontact Athletes Contact Athletes 10 7 8 4 7 9 9 3 13 7 7 6 6 10 12 2 Are the neurological test scores significantly lower for the contact athletes than for the noncontact athletes in the control group? Use a one-tailed test with α = .05. Compute the value of r² (percentage of variance accounted for) for these data.Suppose researchers at an abdominal transplant clinic are concerned about the rate of graft loss due to diabetes status prior to receiving a donor kidney. Research has shown that gender discordance, or receiving a gender from a donor of an opposite gender may increase the risk of both exposure and outcome after transplant. Assume the following tables represent the stratified analysis of the potential confounding variable. (9 points) Gender Discordance Graft Failure No Graft Failure Total Diabetes II 23 10 33 No Diabetes II 4 44 48 Total 27 54 81 Gender Concordance Graft Failure No Graft Failure Total Diabetes II 9 34 43 No Diabetes II 12 87 99 Total 21 121 142 A) Calculate the stratum specific estimates for the odds ratios in each strata. B) Observe the difference in the odds ratios. Based on observation alone, what are we likely to conclude regarding the relationship between outcome and exposure…
