Fill in the missing values in the contingency table. Round your expected frequencies to two or more decimal places, and round your values to three or more decimal places. Send data to Excel Geographic region of the sale Great Lakes Ohio Valley Mid-Atlantic Corn Belt Total 166 69 55 102 The Incisor 74.48 98.00 392 0.403 0.163 Турe of 38 26 21 23 tractor The Caddy 20.52 27.00 108 1.463 0.593 Total 204 95 76 125 500


Correlation
Correlation defines a relationship between two independent variables. It tells the degree to which variables move in relation to each other. When two sets of data are related to each other, there is a correlation between them.
Linear Correlation
A correlation is used to determine the relationships between numerical and categorical variables. In other words, it is an indicator of how things are connected to one another. The correlation analysis is the study of how variables are related.
Regression Analysis
Regression analysis is a statistical method in which it estimates the relationship between a dependent variable and one or more independent variable. In simple terms dependent variable is called as outcome variable and independent variable is called as predictors. Regression analysis is one of the methods to find the trends in data. The independent variable used in Regression analysis is named Predictor variable. It offers data of an associated dependent variable regarding a particular outcome.
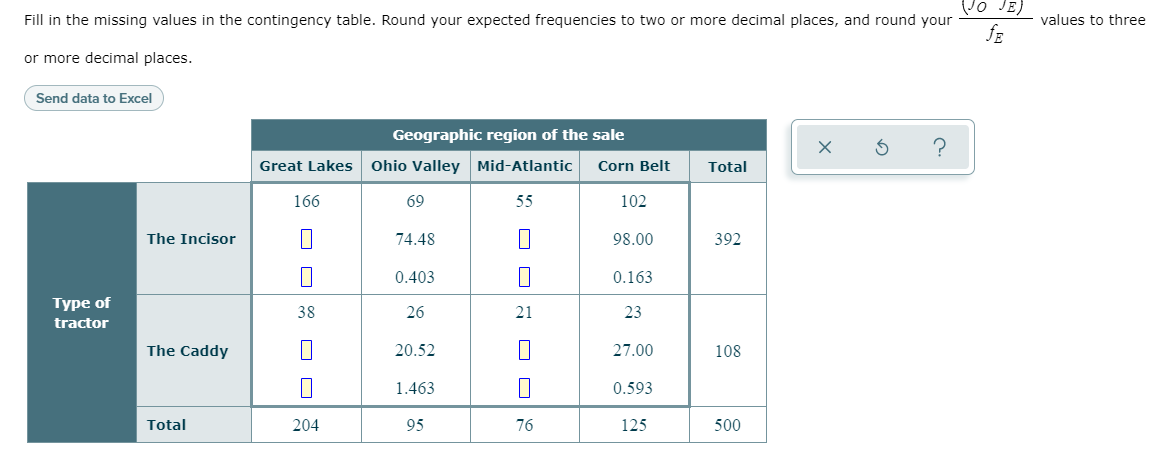
Aragon Equipment, Inc. is a tractor manufacturer that is beginning to realize the importance of sales data in marketing its products. Its two main products are The Incisor, a tractor used in large agricultural settings, and The Caddy, a smaller tractor primarily used in landscape. The company divides its market into four geographic regions. With the aim of maximally allocating its resources, Aragon decides to investigate whether there is a relationship between the variables type of Aragon tractor sold ("The Incisor" or "The Caddy") and geographic region of the sale ("Great Lakes", "Ohio Valley", "Mid-Atlantic", or "Corn Belt").
The contingency table below summarizes sales data from 500 Aragon tractor sales. Each cell of the table contains three numbers: the first number is the observed cell frequency (fO); the second number is the expected cell frequency (fE) under the assumption that there is no relationship between the type of tractor sold and the geographic region of the sale; and the third number is the following value.


Trending now
This is a popular solution!

Step by step
Solved in 2 steps


