A confidence interval for a population mean has a margin of error of 2.2. a. Determine the length of the confidence interval. b. If the sample mean is 54.4, obtain the confidence interval. c. Construct a graph that illustrates your results. a. The length of the confidence interval is (Type an integer or a decimal. Do not round.) b. The confidence interval for μ is from to (Type integers or decimals. Do not round.) c. Choose the correct graph below. O A. O C. 51 51 Confidence Interval- 58 58 B. D. 50 50 E Confidence Interval E E
A confidence interval for a population mean has a margin of error of 2.2. a. Determine the length of the confidence interval. b. If the sample mean is 54.4, obtain the confidence interval. c. Construct a graph that illustrates your results. a. The length of the confidence interval is (Type an integer or a decimal. Do not round.) b. The confidence interval for μ is from to (Type integers or decimals. Do not round.) c. Choose the correct graph below. O A. O C. 51 51 Confidence Interval- 58 58 B. D. 50 50 E Confidence Interval E E

Glencoe Algebra 1, Student Edition, 9780079039897, 0079039898, 2018
18th Edition
ISBN:9780079039897
Author:Carter
Publisher:Carter
Chapter10: Statistics
Section10.4: Distributions Of Data
Problem 19PFA

Related questions
Question
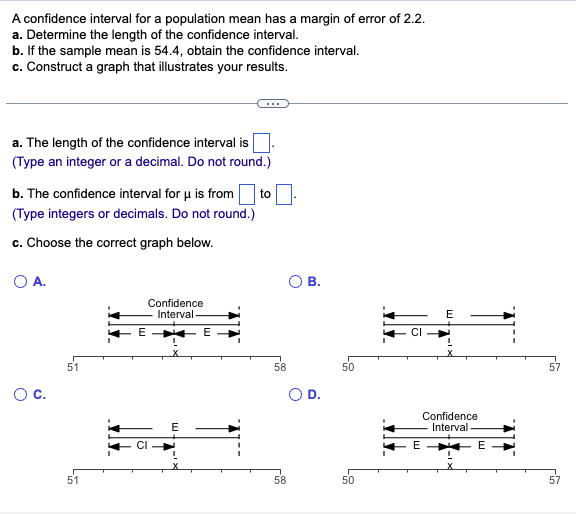
Transcribed Image Text:A confidence interval for a population mean has a margin of error of 2.2.
a. Determine the length of the confidence interval.
b. If the sample mean is 54.4, obtain the confidence interval.
c. Construct a graph that illustrates your results.
a. The length of the confidence interval is
(Type an integer or a decimal. Do not round.)
b. The confidence interval for μ is from to
(Type integers or decimals. Do not round.)
c. Choose the correct graph below.
O A.
O C.
51
51
E
Confidence
Interval.
E
E
58
58
B.
50
50
CI
E
E
Confidence
Interval.
E
57
57
Expert Solution
This question has been solved!
Explore an expertly crafted, step-by-step solution for a thorough understanding of key concepts.

Step by step
Solved in 4 steps

Recommended textbooks for you
Glencoe Algebra 1, Student Edition, 9780079039897…
Algebra
ISBN:
9780079039897
Author:
Carter
Publisher:
McGraw Hill
Glencoe Algebra 1, Student Edition, 9780079039897…
Algebra
ISBN:
9780079039897
Author:
Carter
Publisher:
McGraw Hill