(a) Construct an R chart for these data. Does the R chart indicate that the process is in a state of statistical control? Why? If the R chart indicates the process is not in control, remove out-of-control points, and re-construct the chart with the remaining data. (e) Construct a X chart bascd on the range for these data. Does the X chart indicate that the process is in a state of statistical control? Why? (d) What conclusions can you draw about this process? (e) Construct an s chart for these data. (p Does the s chart indicate that the process is in a state of statistical control? Why? If the s chart
(a) Construct an R chart for these data. Does the R chart indicate that the process is in a state of statistical control? Why? If the R chart indicates the process is not in control, remove out-of-control points, and re-construct the chart with the remaining data. (e) Construct a X chart bascd on the range for these data. Does the X chart indicate that the process is in a state of statistical control? Why? (d) What conclusions can you draw about this process? (e) Construct an s chart for these data. (p Does the s chart indicate that the process is in a state of statistical control? Why? If the s chart

Glencoe Algebra 1, Student Edition, 9780079039897, 0079039898, 2018
18th Edition
ISBN:9780079039897
Author:Carter
Publisher:Carter
Chapter10: Statistics
Section10.5: Comparing Sets Of Data
Problem 14PPS

Related questions
Question
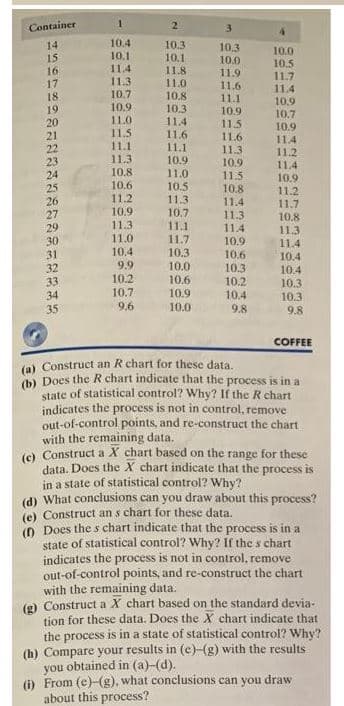
Transcribed Image Text:Container
2
3.
10.4
10.3
10.1
11.8
11.0
10.8
10.3
11.4
11.6
11.1
10.9
11.0
10.5
11.3
10.7
14
10.3
10.0
11.9
10.0
10.1
11.4
11.3
10.7
15
10.5
16
11.7
11.4
10.9
10.7
10.9
11.4
11.2
17
11.6
11.1
10.9
18
19
20
21
22
23
24
25
26
27
10.9
11.0
11.5
11.1
11.3
10.8
10.6
11.2
11.5
11.6
11.3
10.9
11.5
10.8
11.4
11.4
10.9
11.2
11.7
10.9
11.3
11.4
10.8
11.3
11.1
29
30
31
32
33
34
35
11.3
11.4
10.4
10.4
11.0
10.4
11.7
10.3
10.9
10.6
9.9
10.2
10.7
9.6
10.0
10.6
10.3
10.2
10.4
10.3
10.3
10.9
10.0
9.8
9.8
COFFEE
(a) Construct an R chart for these data.
) Does the R chart indicate that the process is in a
state of statistical control? Why? If the R chart
indicates the process is not in control, remove
out-of-control points, and re-construct the chart
with the remaining data.
e) Construct a X chart based on the range for these
data, Does the X chart indicate that the process is
in a state of statistical control? Why?
(d) What conclusions can you draw about this process?
(e) Construct an s chart for these data.
(D Does the s chart indicate that the process is in a
state of statistical control? Why? If the s chart
indicates the process is not in control, remove
out-of-control points, and re-construct the chart
with the remaining data.
(e) Construct a X chart based on the standard devia-
tion for these data. Does the X chart indicate that
the process is in a state of statistical control? Why?
(h) Compare your results in (e)-(g) with the results
you obtained in (a)-(d).
(i) From (e)-(g), what conclusions can you draw
about this process?
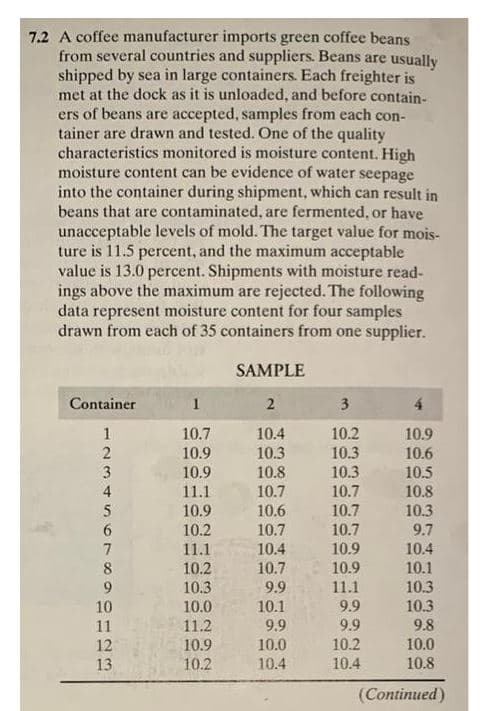
Transcribed Image Text:7.2 A coffee manufacturer imports green coffee beans
from several countries and suppliers. Beans are usually
shipped by sea in large containers. Each freighter is
met at the dock as it is unloaded, and before contain-
ers of beans are accepted, samples from each con-
tainer are drawn and tested. One of the quality
characteristics monitored is moisture content. High
moisture content can be evidence of water seepage
into the container during shipment, which can result in
beans that are contaminated, are fermented, or have
unacceptable levels of mold. The target value for mois-
ture is 11.5 percent, and the maximum acceptable
value is 13.0 percent. Shipments with moisture read-
ings above the maximum are rejected. The following
data represent moisture content for four samples
drawn from each of 35 containers from one supplier.
SAMPLE
Container
1
3
4.
10.7
10.4
10.2
10.3
1
10.9
10.9
10.9
10.3
10.6
10.8
10.3
10.5
10.7
11.1
10.9
10.2
10.7
10.8
10.3
9.7
4
5
10.6
10.7
10.7
10.7
10.9
10.9
6
7
11.1
10.4
10.4
10.1
10.3
10.2
10.7
9.
10.3
9.9
11.1
10
10.0
10.1
9.9
10.3
11
11.2
9.9
9.9
9.8
12
10.9
10.0
10.2
10.0
13
10.2
10.4
10.4
10.8
(Continued)
Expert Solution
Step 1
Hello! As you have posted more than 3 sub parts, we are answering the first 3 sub-parts. In case you require the unanswered parts also, kindly re-post that parts separately.
a)
| Container | 1 | 2 | 3 | 4 | max | min | Range |
| 1 | 10.7 | 10.4 | 10.2 | 10.9 | 10.9 | 10.2 | max-min=0.7 |
| 2 | 10.9 | 10.3 | 10.3 | 10.6 | 10.9 | 10.3 | 0.6 |
| 3 | 10.9 | 10.8 | 10.3 | 10.5 | 10.9 | 10.3 | 0.6 |
| 4 | 11.1 | 10.7 | 10.7 | 10.8 | 11.1 | 10.7 | 0.4 |
| 5 | 10.9 | 10.6 | 10.7 | 10.3 | 10.9 | 10.3 | 0.6 |
| 6 | 10.2 | 10.7 | 10.7 | 9.7 | 10.7 | 9.7 | 1 |
| 7 | 11.1 | 10.4 | 10.9 | 10.4 | 11.1 | 10.4 | 0.7 |
| 8 | 10.2 | 10.7 | 10.9 | 10.1 | 10.9 | 10.1 | 0.8 |
| 9 | 10.3 | 9.9 | 11.1 | 10.3 | 11.1 | 9.9 | 1.2 |
| 10 | 10 | 10.1 | 9.9 | 10.3 | 10.3 | 9.9 | 0.4 |
| 11 | 11.2 | 9.9 | 9.9 | 9.8 | 11.2 | 9.8 | 1.4 |
| 12 | 10.9 | 10 | 10.2 | 10 | 10.9 | 10 | 0.9 |
| 13 | 10.2 | 10.4 | 10.4 | 10.8 | 10.8 | 10.2 | 0.6 |
| 14 | 10.4 | 10.3 | 10.3 | 10 | 10.4 | 10 | 0.4 |
| 15 | 10.1 | 10.1 | 10 | 10.5 | 10.5 | 10 | 0.5 |
| 16 | 11.4 | 11.8 | 11.9 | 11.7 | 11.9 | 11.4 | 0.5 |
| 17 | 11.3 | 11 | 11.6 | 11.4 | 11.6 | 11 | 0.6 |
| 18 | 10.7 | 10.8 | 11.1 | 10.9 | 11.1 | 10.7 | 0.4 |
| 19 | 10.9 | 10.3 | 10.9 | 10.7 | 10.9 | 10.3 | 0.6 |
| 20 | 11 | 11.4 | 11.5 | 10.9 | 11.5 | 10.9 | 0.6 |
| 21 | 11.5 | 11.6 | 11.6 | 11.4 | 11.6 | 11.4 | 0.2 |
| 22 | 11.1 | 11.1 | 11.3 | 11.2 | 11.3 | 11.1 | 0.2 |
| 23 | 11.3 | 10.9 | 10.9 | 11.4 | 11.4 | 10.9 | 0.5 |
| 24 | 10.8 | 11 | 11.5 | 10.9 | 11.5 | 10.8 | 0.7 |
| 25 | 10.6 | 10.5 | 10.8 | 11.2 | 11.2 | 10.5 | 0.7 |
| 26 | 11.2 | 11.3 | 11.4 | 11.7 | 11.7 | 11.2 | 0.5 |
| 27 | 10.9 | 10.7 | 11.3 | 10.8 | 11.3 | 10.7 | 0.6 |
| 28 | 11.3 | 11.1 | 11.4 | 11.3 | 11.4 | 11.1 | 0.3 |
| 29 | 11 | 11.7 | 10.9 | 11.4 | 11.7 | 10.9 | 0.8 |
| 30 | 10.4 | 10.3 | 10.6 | 10.4 | 10.6 | 10.3 | 0.3 |
| 31 | 9.9 | 10 | 10.3 | 10.4 | 10.4 | 9.9 | 0.5 |
| 32 | 10.2 | 10.6 | 10.2 | 10.3 | 10.6 | 10.2 | 0.4 |
| 33 | 10.7 | 10.9 | 10.4 | 10.3 | 10.9 | 10.3 | 0.6 |
| 34 | 9.6 | 10 | 9.8 | 9.8 | 10 | 9.6 | 0.4 |
Control limits:
For the subgroup size k=4, the value of constant D4 is 2.282 and D3=0.

Step by step
Solved in 3 steps with 3 images

Recommended textbooks for you
Glencoe Algebra 1, Student Edition, 9780079039897…
Algebra
ISBN:
9780079039897
Author:
Carter
Publisher:
McGraw Hill
Glencoe Algebra 1, Student Edition, 9780079039897…
Algebra
ISBN:
9780079039897
Author:
Carter
Publisher:
McGraw Hill