Suppose the equation estimated using data is: log(rent) = .043 + .066 log(pop) + .507 log(avginc) + .0056 pctstu (.081) (.844) (.039) (.0017) n = 64, R² = 458. We would like to test the hypothesis that size of the student body relative to the population has no ceteris paribus effect on monthly rents. Can you reject the hypothesis against the two-sided alternative at the 5% levels? Yes because the t statistics is above the critical value. We can reject the hypothesis HO: beta3=0. Yes because the t statistics is below the critical value. We can reject the hypothesis HO: beta3 =0. ONo because the t statistics is above the critical value. We cannot reject the hypothesis HO: beta3 =0. O No because the t statistics is below the critical value. We cannot reject the hypothesis HO: beta3 =0. Question 8 Using the standard normal approximation, find the 95% confidence interval for beta3. The lower bound = Blank 1 The upper bound = Blank 2 Round off your answer up to 3 decimal places. (If 0.01 is the answer, you can answer either 0.01, 0.01o, .01, or .010. Blank # 1 Blank # 2
Suppose the equation estimated using data is: log(rent) = .043 + .066 log(pop) + .507 log(avginc) + .0056 pctstu (.081) (.844) (.039) (.0017) n = 64, R² = 458. We would like to test the hypothesis that size of the student body relative to the population has no ceteris paribus effect on monthly rents. Can you reject the hypothesis against the two-sided alternative at the 5% levels? Yes because the t statistics is above the critical value. We can reject the hypothesis HO: beta3=0. Yes because the t statistics is below the critical value. We can reject the hypothesis HO: beta3 =0. ONo because the t statistics is above the critical value. We cannot reject the hypothesis HO: beta3 =0. O No because the t statistics is below the critical value. We cannot reject the hypothesis HO: beta3 =0. Question 8 Using the standard normal approximation, find the 95% confidence interval for beta3. The lower bound = Blank 1 The upper bound = Blank 2 Round off your answer up to 3 decimal places. (If 0.01 is the answer, you can answer either 0.01, 0.01o, .01, or .010. Blank # 1 Blank # 2

College Algebra
7th Edition
ISBN:9781305115545
Author:James Stewart, Lothar Redlin, Saleem Watson
Publisher:James Stewart, Lothar Redlin, Saleem Watson
Chapter1: Equations And Graphs
Section: Chapter Questions
Problem 10T: Olympic Pole Vault The graph in Figure 7 indicates that in recent years the winning Olympic men’s...

Related questions
Question
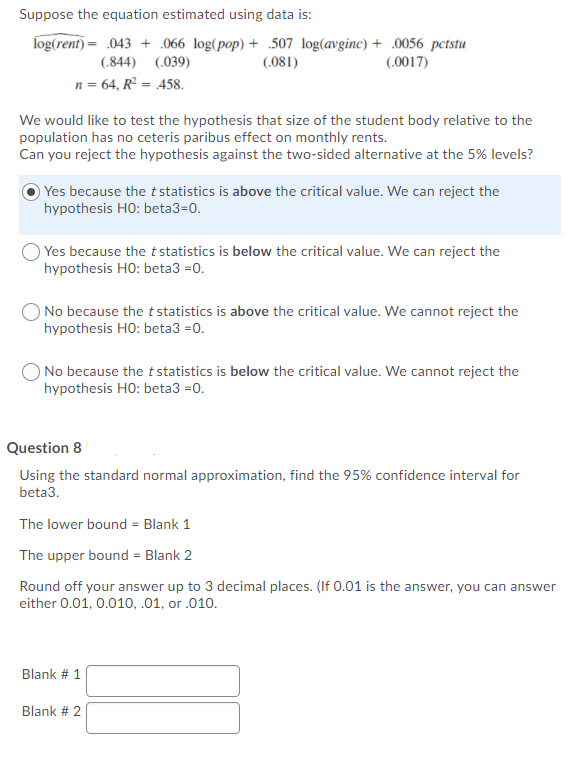
Transcribed Image Text:Suppose the equation estimated using data is:
log(rent) = .043 + .066 log(pop) + 507 log(avginc) + .0056 pctstu
(.081)
(.844) (.039)
(.0017)
n = 64, R² = .458.
We would like to test the hypothesis that size of the student body relative to the
population has no ceteris paribus effect on monthly rents.
Can you reject the hypothesis against the two-sided alternative at the 5% levels?
OYes because the t statistics is above the critical value. We can reject the
hypothesis HO: beta3=0.
Yes because the t statistics is below the critical value. We can reject the
hypothesis HO: beta3 =0.
No because the tstatistics is above the critical value. We cannot reject the
hypothesis HO: beta3 =0.
No because the t statistics is below the critical value. We cannot reject the
hypothesis HO: beta3 =0.
Question 8
Using the standard normal approximation, find the 95% confidence interval for
beta3.
The lower bound = Blank 1
The upper bound = Blank 2
Round off your answer up to 3 decimal places. (If 0.01 is the answer, you can answer
either 0.01, 0.010, .01, or .010.
Blank # 1
Blank # 2
![Question 5
Suppose that the causal population regression model (the true model) is given by.
where y is the wage, x] is the individual's education (years of education), x2 is the individual's on-the-job training,
and x3 is the individual's ability.
Suppose that we know the true population parameters are given as:
Bo = 15, B1= 0.2, 2= 0.1, 53= 1.0
You do not observe ability and run the following regression model:
y = bo+ bjx+ bgx +e (2)
where bo, b1 , and b, are parameters and e is the error term. As we already discussed, the error term e in
Equation (2) includes B3%3+ *.
Suppose you got three observations (for illustration purpose, assume that this is the population data; i.e.
you are only interested in these three individuals.).
Years of Education (X1)
Wage (Y)
On-the-job Training (X2)
Error Term (e)
15
15
30
10.5
10
20
10
-9
20
10
40
20
What is the sign of the bias in the estimate of 6, if you run regression without x3 ? [Blank 1]
What is the sign of the bias in the estimate of ß, if you run regression without x3 ? [Blank 2]
Note: Give an answer either positive or negative.
Blank # 1
Blank # 2](/v2/_next/image?url=https%3A%2F%2Fcontent.bartleby.com%2Fqna-images%2Fquestion%2F8c341255-830a-4061-af4f-983d929ebd8f%2F666e7e17-1187-4ac4-86f9-761ea63dff2a%2Fyev58s3_processed.png&w=3840&q=75)
Transcribed Image Text:Question 5
Suppose that the causal population regression model (the true model) is given by.
where y is the wage, x] is the individual's education (years of education), x2 is the individual's on-the-job training,
and x3 is the individual's ability.
Suppose that we know the true population parameters are given as:
Bo = 15, B1= 0.2, 2= 0.1, 53= 1.0
You do not observe ability and run the following regression model:
y = bo+ bjx+ bgx +e (2)
where bo, b1 , and b, are parameters and e is the error term. As we already discussed, the error term e in
Equation (2) includes B3%3+ *.
Suppose you got three observations (for illustration purpose, assume that this is the population data; i.e.
you are only interested in these three individuals.).
Years of Education (X1)
Wage (Y)
On-the-job Training (X2)
Error Term (e)
15
15
30
10.5
10
20
10
-9
20
10
40
20
What is the sign of the bias in the estimate of 6, if you run regression without x3 ? [Blank 1]
What is the sign of the bias in the estimate of ß, if you run regression without x3 ? [Blank 2]
Note: Give an answer either positive or negative.
Blank # 1
Blank # 2
Expert Solution
This question has been solved!
Explore an expertly crafted, step-by-step solution for a thorough understanding of key concepts.

This is a popular solution!

Trending now
This is a popular solution!

Step by step
Solved in 3 steps with 4 images

Recommended textbooks for you
College Algebra
Algebra
ISBN:
9781305115545
Author:
James Stewart, Lothar Redlin, Saleem Watson
Publisher:
Cengage Learning

Functions and Change: A Modeling Approach to Coll…
Algebra
ISBN:
9781337111348
Author:
Bruce Crauder, Benny Evans, Alan Noell
Publisher:
Cengage Learning

Linear Algebra: A Modern Introduction
Algebra
ISBN:
9781285463247
Author:
David Poole
Publisher:
Cengage Learning
College Algebra
Algebra
ISBN:
9781305115545
Author:
James Stewart, Lothar Redlin, Saleem Watson
Publisher:
Cengage Learning
Functions and Change: A Modeling Approach to Coll…
Algebra
ISBN:
9781337111348
Author:
Bruce Crauder, Benny Evans, Alan Noell
Publisher:
Cengage Learning
Linear Algebra: A Modern Introduction
Algebra
ISBN:
9781285463247
Author:
David Poole
Publisher:
Cengage Learning