A consumer preference study compares the effects of three different bottle designs (A, B, and C9 on sales of a popular fabric softener, supermarkets are randomly assigned to each bottle design. The number of bottles sold in 24 hours at each supermarket is recorded. The data obtained are displayed in the following table. Bottle Design Study Data 18 31 28
A consumer preference study compares the effects of three different bottle designs (A, B, and C9 on sales of a popular fabric softener, supermarkets are randomly assigned to each bottle design. The number of bottles sold in 24 hours at each supermarket is recorded. The data obtained are displayed in the following table. Bottle Design Study Data 18 31 28

Holt Mcdougal Larson Pre-algebra: Student Edition 2012
1st Edition
ISBN:9780547587776
Author:HOLT MCDOUGAL
Publisher:HOLT MCDOUGAL
Chapter11: Data Analysis And Probability
Section: Chapter Questions
Problem 8CR

Related questions
Question
2ñ
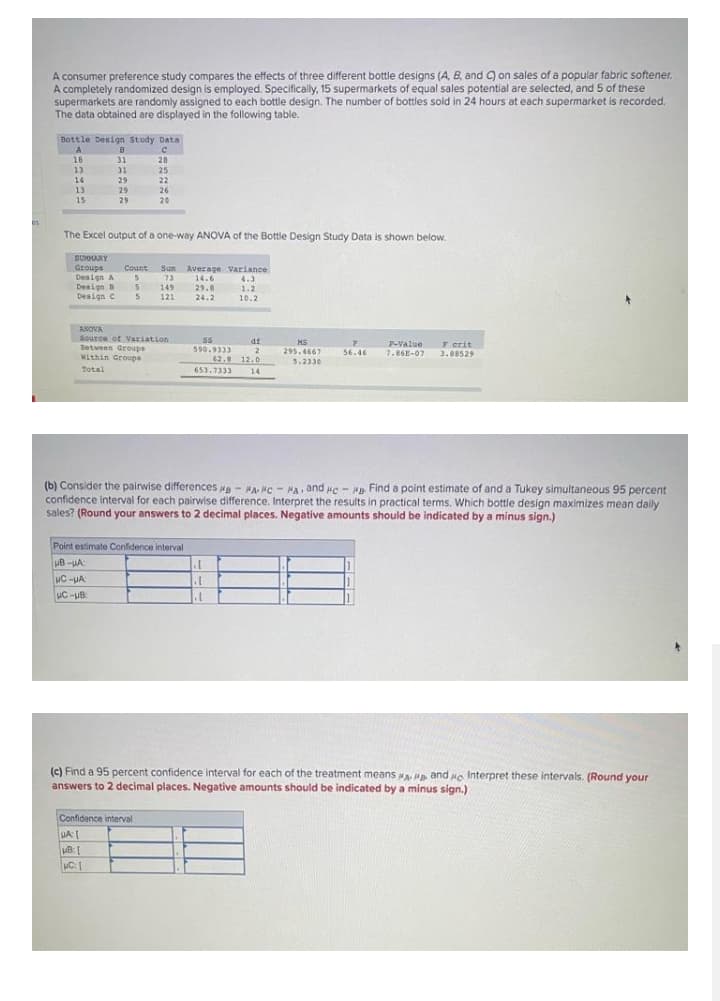
Transcribed Image Text:A consumer preference study compares the effects of three different bottle designs (A, B, and ) on sales of a popular fabric softener,
A completely randomized design is employed. Specifically, 15 supermarkets of equal sales potential are selected, and 5 of these
supermarkets are randomly assigned to each bottle design. The number of bottles sold in 24 hours at each supermarket is recorded.
The data obtained are displayed in the following table.
Bottle Design Study Data
A
18
31
28
13
31
25
14
29
22
13
29
26
15
29
20
The Excel output of a one-way ANOVA of the Bottle Design Study Data is shown below.
SUMMARY
Groups
Design A
n
Count Sum Average Variance
73
14.6
4.3
Design
Design C
S 149
S 121
29.8
1.2
10.2
24.2
ASOVA
Source of Variation
s
590.9333
62.8 12.0
df
Detveen Groups
Mithin Groups
MS
295.4467
5.2330
P-Value
7.86E-07
F erit
3.88529
56.46
Total
653.7333
14
(b) Consider the pairwise differences - MA MC - MA , and ue - An. Find a point estimate of and a Tukey simultaneous 95 percent
confidence interval for each pairwise difference, Interpret the results in practical terms. Which bottle design maximizes mean daily
sales? (Round your answers to 2 decimal places. Negative amounts should be indicated by a minus sign.)
Point estimate Confidence interval
uB-uA
uC -uB:
(c) Find a 95 percent confidence interval for each of the treatment means A M and we Interpret these intervals. (Round your
answers to 2 decimal places. Negative amounts should be indicated by a minus sign.)
Confidence interval
uC:
Expert Solution
This question has been solved!
Explore an expertly crafted, step-by-step solution for a thorough understanding of key concepts.

This is a popular solution!

Trending now
This is a popular solution!

Step by step
Solved in 4 steps

Recommended textbooks for you
Holt Mcdougal Larson Pre-algebra: Student Edition…
Algebra
ISBN:
9780547587776
Author:
HOLT MCDOUGAL
Publisher:
HOLT MCDOUGAL
Holt Mcdougal Larson Pre-algebra: Student Edition…
Algebra
ISBN:
9780547587776
Author:
HOLT MCDOUGAL
Publisher:
HOLT MCDOUGAL