A consumer preference study involving three different bottle designs (A, B, and C) for the jumbo size of a new liquid laundry detergent was carried out using a randomized block experimental design, with supermarkets as blocks. Specifically, four supermarkets were supplied with all three bottle designs, which were priced the same. The following table gives the number of bottles of each design sold in a 24-hour period at each supermarket. If we use these data, SST, SSB, and SSE can be calculated to be 586.1667, 421.6667, and 1.8333, respectively. Results of a Bottle Design Experiment Supermarket, j Bottle Design, i 1 4 A 16 14 1 6 в 33 30 19 23 23 21 12 (a&b) Test the null hypothesis Họ that no differences exist between the effects of the bottle designs and supermarkets on mean daily sales. Set a = .05. Can we conclude that the different bottle designs have different effects on mean sales? (Round F to 2 decimal places and SS, MS to 3 decimal places. Leave no cells blank - be certain to enter "O" wherever required.) Analysis of Variance for factorl Tukey g.05 = 4.34, MSE = .306, s = .553, b = 4 Source DF MS F Bottle Market Error Total (c) Use Tukey simultaneous 95 percent confidence intervals to make pairwise comparisons of the bottle design effects on mean daily sales. Which bottle design(s) maximize mean sales? (Round your answers 2 decimal places. Negative amounts should be indicated by a minus sign.)
A consumer preference study involving three different bottle designs (A, B, and C) for the jumbo size of a new liquid laundry detergent was carried out using a randomized block experimental design, with supermarkets as blocks. Specifically, four supermarkets were supplied with all three bottle designs, which were priced the same. The following table gives the number of bottles of each design sold in a 24-hour period at each supermarket. If we use these data, SST, SSB, and SSE can be calculated to be 586.1667, 421.6667, and 1.8333, respectively. Results of a Bottle Design Experiment Supermarket, j Bottle Design, i 1 4 A 16 14 1 6 в 33 30 19 23 23 21 12 (a&b) Test the null hypothesis Họ that no differences exist between the effects of the bottle designs and supermarkets on mean daily sales. Set a = .05. Can we conclude that the different bottle designs have different effects on mean sales? (Round F to 2 decimal places and SS, MS to 3 decimal places. Leave no cells blank - be certain to enter "O" wherever required.) Analysis of Variance for factorl Tukey g.05 = 4.34, MSE = .306, s = .553, b = 4 Source DF MS F Bottle Market Error Total (c) Use Tukey simultaneous 95 percent confidence intervals to make pairwise comparisons of the bottle design effects on mean daily sales. Which bottle design(s) maximize mean sales? (Round your answers 2 decimal places. Negative amounts should be indicated by a minus sign.)

Holt Mcdougal Larson Pre-algebra: Student Edition 2012
1st Edition
ISBN:9780547587776
Author:HOLT MCDOUGAL
Publisher:HOLT MCDOUGAL
Chapter11: Data Analysis And Probability
Section: Chapter Questions
Problem 8CR

Related questions
Topic Video
Question
100%
Please see question:
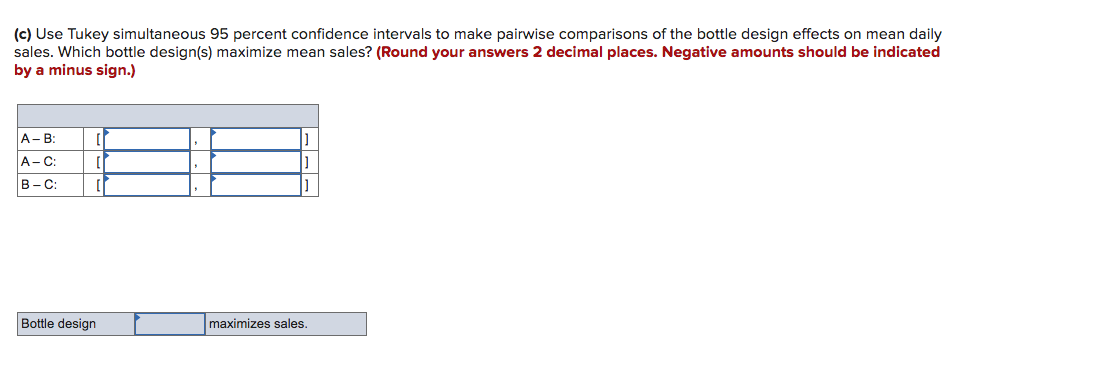
Transcribed Image Text:(c) Use Tukey simultaneous 95 percent confidence intervals to make pairwise comparisons of the bottle design effects on mean daily
sales. Which bottle design(s) maximize mean sales? (Round your answers 2 decimal places. Negative amounts should be indicated
by a minus sign.)
A- B:
A-C:
В -С:
Bottle design
maximizes sales.
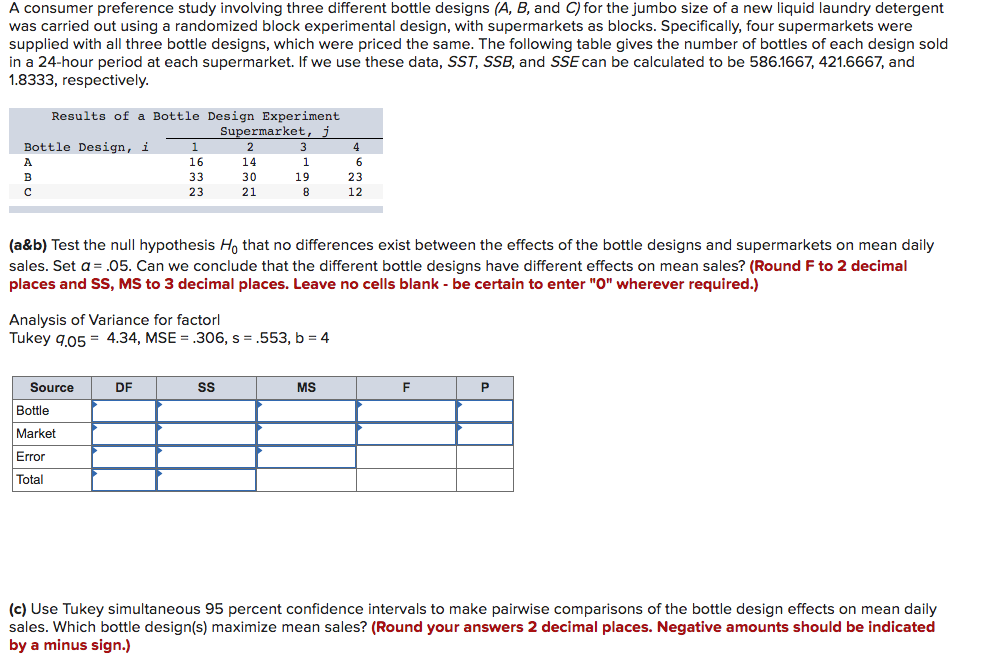
Transcribed Image Text:A consumer preference study involving three different bottle designs (A, B, and C) for the jumbo size of a new liquid laundry detergent
was carried out using a randomized block experimental design, with supermarkets as blocks. Specifically, four supermarkets were
supplied with all three bottle designs, which were priced the same. The following table gives the number of bottles of each design sold
in a 24-hour period at each supermarket. If we use these data, SST, SSB, and SSE can be calculated to be 586.1667, 421.6667, and
1.8333, respectively.
Results of a Bottle Design Experiment
Supermarket, j
Bottle Design, i
1
4
A
16
14
1
6
B
33
30
19
23
23
21
12
(a&b) Test the null hypothesis H, that no differences exist between the effects of the bottle designs and supermarkets on mean daily
sales. Set a = .05. Can we conclude that the different bottle designs have different effects on mean sales? (Round F to 2 decimal
places and SS, MS to 3 decimal places. Leave no cells blank - be certain to enter "O" wherever required.)
Analysis of Variance for factorl
Tukey q.05 = 4.34, MSE = .306, s = .553, b = 4
Source
DF
MS
F
P
Bottle
Market
Error
Total
(c) Use Tukey simultaneous 95 percent confidence intervals to make pairwise comparisons of the bottle design effects on mean daily
sales. Which bottle design(s) maximize mean sales? (Round your answers 2 decimal places. Negative amounts should be indicated
by a minus sign.)
Expert Solution
This question has been solved!
Explore an expertly crafted, step-by-step solution for a thorough understanding of key concepts.

This is a popular solution!

Trending now
This is a popular solution!

Step by step
Solved in 2 steps with 3 images

Knowledge Booster


Learn more about
Need a deep-dive on the concept behind this application? Look no further. Learn more about this topic, statistics and related others by exploring similar questions and additional content below.Recommended textbooks for you
Holt Mcdougal Larson Pre-algebra: Student Edition…
Algebra
ISBN:
9780547587776
Author:
HOLT MCDOUGAL
Publisher:
HOLT MCDOUGAL

College Algebra (MindTap Course List)
Algebra
ISBN:
9781305652231
Author:
R. David Gustafson, Jeff Hughes
Publisher:
Cengage Learning
Holt Mcdougal Larson Pre-algebra: Student Edition…
Algebra
ISBN:
9780547587776
Author:
HOLT MCDOUGAL
Publisher:
HOLT MCDOUGAL
College Algebra (MindTap Course List)
Algebra
ISBN:
9781305652231
Author:
R. David Gustafson, Jeff Hughes
Publisher:
Cengage Learning