(a) Convert both x¡ and x2 values to z values, and locate both of these values under the standard normal curve. (b) Which of these two items is the more unusual as an archaeological find in its location?
(a) Convert both x¡ and x2 values to z values, and locate both of these values under the standard normal curve. (b) Which of these two items is the more unusual as an archaeological find in its location?

MATLAB: An Introduction with Applications
6th Edition
ISBN:9781119256830
Author:Amos Gilat
Publisher:Amos Gilat
Chapter1: Starting With Matlab
Section: Chapter Questions
Problem 1P

Related questions
Question
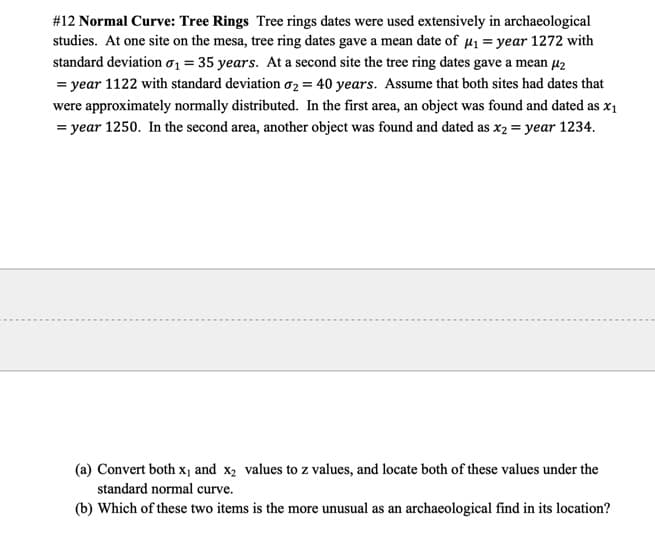
Transcribed Image Text:#12 Normal Curve: Tree Rings Tree rings dates were used extensively in archaeological
studies. At one site on the mesa, tree ring dates gave a mean date of µ1 = year 1272 with
standard deviation o1 = 35 years. At a second site the tree ring dates gave a mean uz
= year 1122 with standard deviation o2 = 40 years. Assume that both sites had dates that
were approximately normally distributed. In the first area, an object was found and dated as x1
= year 1250. In the second area, another object was found and dated as x2 = year 1234.
(a) Convert both x¡ and x2 values to z values, and locate both of these values under the
standard normal curve.
(b) Which of these two items is the more unusual as an archaeological find in its location?
Expert Solution
This question has been solved!
Explore an expertly crafted, step-by-step solution for a thorough understanding of key concepts.

This is a popular solution!

Trending now
This is a popular solution!

Step by step
Solved in 2 steps with 2 images

Recommended textbooks for you
MATLAB: An Introduction with Applications
Statistics
ISBN:
9781119256830
Author:
Amos Gilat
Publisher:
John Wiley & Sons Inc

Probability and Statistics for Engineering and th…
Statistics
ISBN:
9781305251809
Author:
Jay L. Devore
Publisher:
Cengage Learning

Statistics for The Behavioral Sciences (MindTap C…
Statistics
ISBN:
9781305504912
Author:
Frederick J Gravetter, Larry B. Wallnau
Publisher:
Cengage Learning
MATLAB: An Introduction with Applications
Statistics
ISBN:
9781119256830
Author:
Amos Gilat
Publisher:
John Wiley & Sons Inc
Probability and Statistics for Engineering and th…
Statistics
ISBN:
9781305251809
Author:
Jay L. Devore
Publisher:
Cengage Learning
Statistics for The Behavioral Sciences (MindTap C…
Statistics
ISBN:
9781305504912
Author:
Frederick J Gravetter, Larry B. Wallnau
Publisher:
Cengage Learning

Elementary Statistics: Picturing the World (7th E…
Statistics
ISBN:
9780134683416
Author:
Ron Larson, Betsy Farber
Publisher:
PEARSON

The Basic Practice of Statistics
Statistics
ISBN:
9781319042578
Author:
David S. Moore, William I. Notz, Michael A. Fligner
Publisher:
W. H. Freeman

Introduction to the Practice of Statistics
Statistics
ISBN:
9781319013387
Author:
David S. Moore, George P. McCabe, Bruce A. Craig
Publisher:
W. H. Freeman