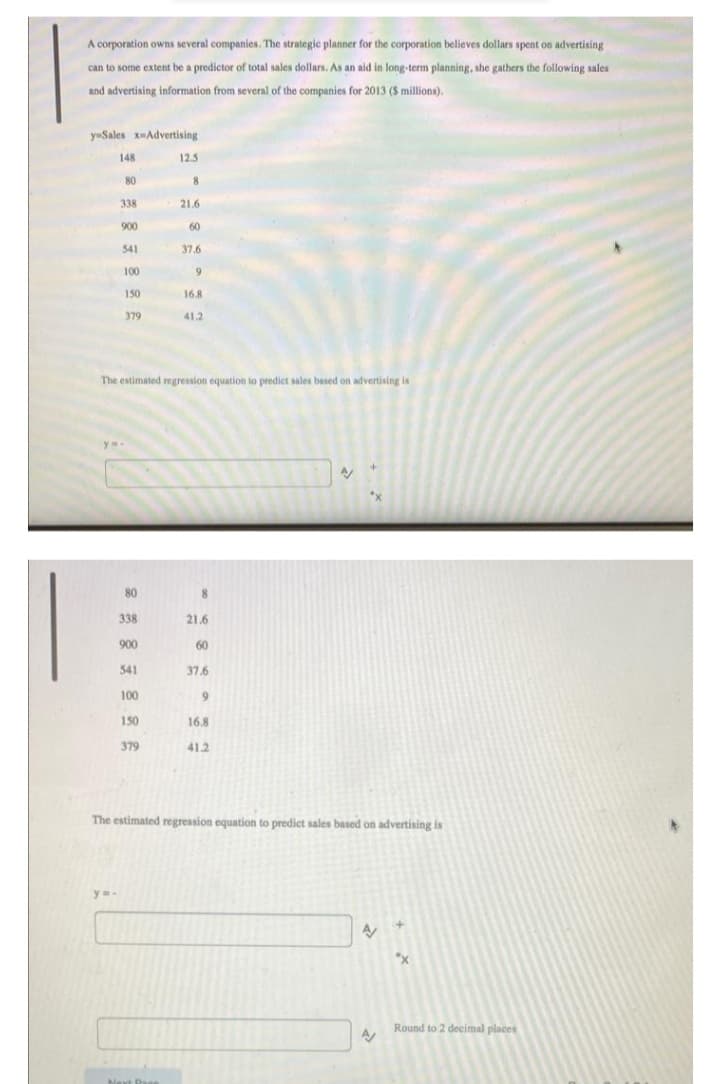
The estimated regression equation to predict sales based on advertising is


Q: Write down the estimated multiple regression model of the beginning salary on education, gender and…
A: It is given that Y-intercept = -3019.226 Coefficient of Education = 658.518 Coefficient of Gender =…
Q: Webster Chemical Company produces mastics and caulking for the construction industry. The product is…
A:
Q: 1. A bowl contains five chips numbered 1 to 5. A sample of two drawn without replacement from this…
A: The given population, i.e., the chips numbers defined in the bowls is : 1, 2, 3, 4, 5 (i.e.,…
Q: A researcher is interested in finding a 98% confidence interval for the mean number minutes students…
A:
Q: 28 The standard error of estimate, se(e), for the regression is: a 59.320 b 49.433…
A: Given :
Q: Advertising Cost (X) Annual Sales (Y) 0.9 2 1.1 1.1 6. 1.4 8. 1.5 10 1.9 12
A: .
Q: 1 The sample mean is _______. a 12.32 b 13.25 c 14.25 d 15.32
A:
Q: In a random sample of 100 adults, 27 say they are in favor of outlawing cigarettes. Let p be the…
A: Given the relevant test is; H0: p=0.23vs Ha: p≠0.23and p^=27100=0.27
Q: Q1. (a) Write down the four assumptions of the simple linear regression model. (b) Draw graphs for…
A:
Q: A recent study of 85 workers found that 61 people rode the bus to work each day. Find the 95%…
A: Given that A recent study of 85 workers found that 61 people rode the bus to work each day. Find…
Q: Listen tline the process we used in developing the best time series forecasting model.
A:
Q: A recent poll has stated that 65% of people need to have their morning coffee to start the day. A…
A:
Q: An experiment was performed to compare the abrasive wear of two different coating materials on the…
A:
Q: attempt to hack a website, each hacker with his/her probability of success per attempt, P1, ..., PN,…
A:
Q: A particular fruit's weights are normally distributed, with a mean of 690 grams and a standard…
A:
Q: A player pays $10 to roll two six-sided dice. She wins $50 if she rolls a sum of 10 and $20 if she…
A:
Q: Consider the data in the table below. Y X 3 1 4 8 3 1 7 6. 1. In the space below (or on a separate…
A:
Q: question 18 You want to obtain a sample to estimate a population proportion. Based on previous…
A:
Q: Assume that a sample is used to estimate a population mean u. Find the margin of error M.E. that…
A:
Q: 3.1 Solve the below problem Let Y,, Y2, and Y, be random variables, where E (Y,) = 1, E (Y2) =…
A: Solution is in image uploaded below
Q: Face cards Color Suit Ace Two Three Four Five Six Seven Eight Nine Ten Jack Queen King Red Hearts Av…
A: Note: Hi, thank you for the question. As per our company guideline we are supposed to answer only…
Q: AGE RANGE COVID CASES 9 and below 143 10-19 270 20-29 2852 30-39 2325 40-49 1465 50-59 930 60-69 518…
A: The cumulative frequency of a certain class can be calculated by adding up the frequency of that…
Q: 1) Have the samples been collected independently or dependently? Answer the question and provide a…
A: Given:
Q: Part 1: OLS basics Consider the data in the table below. Y X 3 1 8. 3 2 1 7 1. In the space below…
A:
Q: 2.3 BP petrol is to be stocked in a bulk tank once at the beginning of each week and then sold to…
A: Answer is as follows
Q: cereal, in one-pound boxes. According to FDA regulations, a one-pound box must contain at least 15.5…
A:
Q: c. Based on the mean and median, are the data skewed? If so, how? Selēct all thal apply. O A. The…
A: The objective is to determine if the data is skewed based on mean and median.
Q: The controller of Crane Industries has collected the following monthly cost data for analyzing the…
A: Given the data as Total Electricity Costs Total Machine Hours January 2200 260 February…
Q: Question 2 Part 1(a) York university parking services forecasted the number of parking passes issued…
A: I. a From the given information, Month Number of parking passes issued Forecast March 1490 1455…
Q: c. For the hypoth O 23.271 O 24 O 26 O 25
A: Kolmogorov Smirnov test is the test used to check whether the data follows Normal distribution and…
Q: 1040 1040 1290 1035 1050 960 745 770 1400 1080 845 1130 1025 1090 830 1075 810 1045 1015 970 1135…
A: The solution and answers are given below
Q: random sample of 15 ECE graduates of a certain school design a schematic diagram of a given…
A:
Q: e for N = 6000 , n = 82 and c = 3 using about 10 points, and also provide your calculated values in…
A: N = 6000 , n = 82 and c = 3 po - sample probabilities po 0 0.01 0.02 0.03 0.04 0.05…
Q: Please use the accompanying Excel data set or accompanying Text file data set when completing the…
A: (a) Use EXCEL to determine the value of intercept and slope. EXCEL procedure: Go to EXCEL…
Q: The data in Table 4.5 of (Dobson and Barnett 2018) show the numbers of cases of AIDS in Australia by…
A:
Q: If N = 100, Compute for the mean, variance, and standard error of the following. 1. n=15, μ = 18, σ…
A: As per bartleby guideline expert have to answer first three subparts only dear student please upload…
Q: b) Four athletes were asked to run 100m without warming up prior to run- ning. On another day they…
A: A hypothesis which is tested for plausible rejection is called the Null Hypothesis (typically…
Q: 0 <x < 1 2x, f(x) =D { %3D 0, otherwise.
A: Solution: From the given information,
Q: Problem 2.3: A continuous probability distribution is expressed through the following expression.…
A: As per our guidelines we are suppose to answer only one. Given,f(x)=ce-8x for x≥00…
Q: What is the following: 1. Sum of XY 2. a=? 3. b=?
A: Fot the given data, we need to find the following: 1. Sum of XY 2. a=? 3. b=?
Q: It is of interest to know if the average time it takes police to reach the scene of an accident…
A: Hypothesis test are used to compare the sample and population. Hypothesis test involves two…
Q: Use an ANOVA with ? = 0.05 to determine whether there are any significant differences among the…
A: Anova is a type of parametric test and it used to measure the mean significant between more than…
Q: 2.4 Complete the below statement. If the covariance of two random variables is zero, the variables…
A: For the given statement Fill in the blanks
Q: In 2008, the per capita consumption of soft drinks in Country A was reported to be of 18.56 gallons…
A: Given, Mean, μ=18.56 Standard deviation, σ=5 X~N(μ, σ)Z=X-μσ
Q: The number of initial public offerings of stock issued in a 10-year period and the total proceeds…
A: Given data is Issues,x 424 457 695 500 499 379 55 74 180 158 Proceeds,y 18716 29004 42559…
Q: randomly Resp 200 teenagers and ask each whether a college education is worth the expense. The table…
A: Given that total frequency=200 α=0.10χ2calculated=70.528
Q: 2.2 Solve the below problem. Table 1 contains the probabilities associated with each possible pair…
A: Solution
Q: Preventing heart attacks: Medical researchers performed a comparison of two drugs, clopidogrel and…
A: Medical researchers performed a comparison of two drugs, clopidogrel and ticagrelor, which are…
Q: An article in the Journal of the American Ceramic Society, "Rapid Hot-Pressing of Ultrafine PSZ…
A: Introduction: The temperature (x) and porosity (y) are given. It is required to fit a linear…
Q: 1.1 In the single-variable case, we saw that the probability function for a discrete random variable…
A: Note: Hi, thank you for the question. As per our company guideline we are supposed to answer only…

Step by step
Solved in 2 steps with 1 images

- Olympic Pole Vault The graph in Figure 7 indicates that in recent years the winning Olympic men’s pole vault height has fallen below the value predicted by the regression line in Example 2. This might have occurred because when the pole vault was a new event there was much room for improvement in vaulters’ performances, whereas now even the best training can produce only incremental advances. Let’s see whether concentrating on more recent results gives a better predictor of future records. (a) Use the data in Table 2 (page 176) to complete the table of winning pole vault heights shown in the margin. (Note that we are using x=0 to correspond to the year 1972, where this restricted data set begins.) (b) Find the regression line for the data in part ‚(a). (c) Plot the data and the regression line on the same axes. Does the regression line seem to provide a good model for the data? (d) What does the regression line predict as the winning pole vault height for the 2012 Olympics? Compare this predicted value to the actual 2012 winning height of 5.97 m, as described on page 177. Has this new regression line provided a better prediction than the line in Example 2?A mail-order business selling personal computer supplies, software and hardware maintains a centralized warehouse. Management is currently examining the process of distribution from the warehouse and wants to study the factors that affect the warehouse distribution costs. Data collected over 24 random months contain the warehouse’s distribution cost (in thousands of Rands), the sales (in thousands of Rands) and the number of orders received. A multiple linear regression model was fitted to the data by using Stat1.2. Use the output to answer the questions that follow by typing only the letter of the correct option in the answer boxes. Variablesy: Warehouse Distribution Costx1: Salesx2: Number of Orders Model Fitting StatisticsR2 = 0.8504Adj R2: ? Regression Coefficients Beta Parameter Standard b Parameter Standard Estimates…In the packaging department of a large aircraft parts distributor, a fairly reliable estimate of packaging and processing costs can be determined by knowing the weight of an order. Thus, the weight is a cost driver that accounts for a sizable fraction of the packaging and processing costs at this company. Data for the past 10 orders are given as follows. Solve, a. Estimate the b0 and b1 coefficients, and determine the linear regression equation to fit these data. b. What is the correlation coefficient (R)? c. If an order weighs 250 lb, how much should it cost to package and process it?
- Jensen Tire & Auto is deciding whether to purchase a maintenance contract for its newcomputer wheel alignment and balancing machine. Managers feel that maintenance expenseshould be related to usage, and they collected the following information on weeklyusage (hours) and annual maintenance expense (in hundreds of dollars). a. Develop a scatter chart with weekly usage hours as the independent variable. Whatdoes the scatter chart indicate about the relationship between weekly usage and annualmaintenance expense?b. Use the data to develop an estimated regression equation that could be used to predictthe annual maintenance expense for a given number of hours of weekly usage. Whatis the estimated regression model? c. Test whether each of the regression parameters b0 and b1 is equal to zero at a 0.05level of significance. What are the correct interpretations of the estimated regressionparameters? Are these interpretations reasonable?d. How much of the variation in the sample values of…The personnel director of a large hospital is interested in determining the relationship (if any) between an employee’s age and the number of sick days the employee takes per year. The director randomly selects ten employees and records their age and the number of sick days which they took in the previous year. Employee 1 2 3 4 5 6 7 8 9 10Age 30 50 40 55 30 28 60 25 30 45Sick Days 7 4 3 2 9 10 0 8 5 2 The estimated regression equation and the standard error are given. Sick Days=14.310162−0.236900(Age) Se=1.682207 Find the 95% prediction interval for the average number of sick days an employee will take per year, given the employee is 34 . Round your answer to two decimal places.A ski resort asked a random sample of guests to rate their satisfaction on various attributes of their visit on a scale of 1–5 with 1 = very unsatisfied and 5 = very satisfied. The estimated regression model was Y = overall satisfaction score, X1 = lift line wait, X2 = amount of ski trail grooming, X3 = safety patrol visibility, and X4 = friendliness of guest services. Predictor Coefficient Intercept 2.9833 LiftWait 0.1458 AmountGroomed 0.2562 SkiPatrolVisibility 0.0428 FriendlinessHosts −0.1298 (a) Write the fitted regression equation. (Round your answers to 4 decimal places. Negative values should be indicated by a minus sign.) yˆy^ = + * LiftWait + * AmountGroomed + * SkiPatrolVisibility + * FriendlinessHosts (b) Interpret each coefficient. Overall satisfaction increases with an increase in satisfaction for each individual predictor except for friendliness of hosts. (d) Make a prediction for Overall Satisfaction when a guest’s satisfaction in…
- A ski resort asked a random sample of guests to rate their satisfaction on various attributes of their visit on a scale of 1–5 with 1 = very unsatisfied and 5 = very satisfied. The estimated regression model was Y = overall satisfaction score, X1 = lift line wait, X2 = amount of ski trail grooming, X3 = safety patrol visibility, and X4 = friendliness of guest services. Predictor Coefficient Intercept 2.7115 LiftWait 0.1474 AmountGroomed 0.2517 SkiPatrolVisibility 0.0656 FriendlinessHosts −0.1172 (a) Write the fitted regression equation. (Round your answers to 4 decimal places. Negative values should be indicated by a minus sign.) yˆy^ = ?? + ?? * LiftWait + ?? * AmountGroomed + ?? * SkiPatrolVisibility + ?? * FriendlinessHosts (b) Interpret each coefficient. Overall satisfaction increases Correctwith an increase in satisfaction for each individual predictor except for friendliness of hosts.(c) Would the intercept seem to have meaning in this…A manufacturing company that produces laminate for countertops is interested in studying the relationship between the number of hours of training that an employee receives and the number of defects per countertop produced. Ten employees are randomly selected. The number of hours of training each employee has received is recorded and the number of defects on the most recent countertop produced is determined. The results are as follows. Hours of Training Defects per Countertop1 54 17 03 32 52 45 15 21 86 2 The estimated regression equation and the standard error are given. Defects per Countertop=6.717822−1.004950(Hours of Training)Se=1.229787 Suppose a new employee has had 1 hour of training. What would be the 90% prediction interval for the number of defects per countertop? Round your answer to two decimal places.A manufacturing company that produces laminate for countertops is interested in studying the relationship between the number of hours of training that an employee receives and the number of defects per countertop produced. Ten employees are randomly selected. The number of hours of training each employee has received is recorded and the number of defects on the most recent countertop produced is determined. The results are as follows. Hours of Training Defects per Countertop1 54 17 03 32 52 45 15 21 86 2 The estimated regression equation and the standard error are given. Defects per Countertop=6.717822−1.004950(Hours of Training)Se=1.229787S Suppose a new employee has had 3 hours of training. What would be the 95 prediction interval for the number of defects per countertop? Round your answer to two decimal places.
- According to "Reproductive Biology of the Aquatic Salamander Amphiuma tridactylum in Louisiana,"† the size of a female salamander's snout is correlated with the number of eggs in her clutch. The following data are consistent with summary quantities reported in the article. Partial Minitab output is also included. Snout-Vent Length Clutch Size 32 45 53 215 53 160 53 170 54 190 57 200 57 270 58 175 58 245 59 215 63 170 63 240 64 245 67 280 The regression equation is Y = -133 + 5.92x Predictor Coef Stdev T P Constant -133.02 64.30 2.07 0.0608 x 5.919 1.127 5.25 0.0002 s = 33.90 R-sq = 69.7% R-sq(adj) = 67.2% Additional summary statistics are given below. n = 14 x = 56.5 y = 201.4 Σx2 = 45,597 Σy2 = 613,550 Σxy = 164,690 You can use the Distribution Calculators page in SALT to find critical values and/or p-values to answer parts of this question. (a) What is the equation of the regression line…A ski resort asked a random sample of guests to rate their satisfaction on various attributes of their visit on a scale of 1–5 with 1 = very unsatisfied and 5 = very satisfied. The estimated regression model was Y = overall satisfaction score, X1 = lift line wait, X2 = amount of ski trail grooming, X3 = safety patrol visibility, and X4 = friendliness of guest services. Predictor Coefficient Intercept 2.9018 LiftWait 0.1642 AmountGroomed 0.2343 SkiPatrolVisibility 0.0602 FriendlinessHosts −0.1193 (a) Write the fitted regression equation. (Round your answers to 4 decimal places. Negative values should be indicated by a minus sign.) yˆy^ = + * LiftWait + * AmountGroomed + * SkiPatrolVisibility + * FriendlinessHosts (b) Interpret each coefficient. Overall satisfaction (Click to select) increases decreases remains same with an increase in satisfaction for each individual predictor except for friendliness of hosts.(c) Would the intercept seem to…A sixth-grade teacher believes that there is a relationship between his students’ IQscores (y) and the numbers of hours (x) they spend watching television each week. Thefollowing table shows a random sample of 7 sixth-grade students.y 125 116 97 114 85 107 105x 5 10 30 16 41 28 21 Does the data provide sufficient evidence to indicate that the simple linear regressionmodel is appropriate to describe the relationship between x and y? Perform a model utilitytest at α = 0.05. (Give H0, Ha, rejection region, observed test statistic, P-value, decisionand conclusion.)Find the Pearson sample correlation coefficient between x and y. Then interpretthe result.

