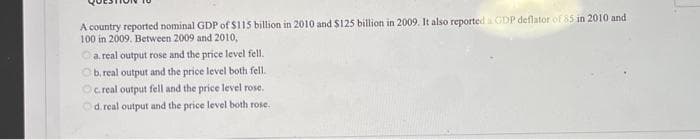
A country reported nominal GDP of $115 billion in 2010 and $125 billion in 2009. It also reported a GDP deflator of 85 in 2010 and 100 in 2009. Between 2009 and 2010, Ca. real output rose and the price level fell. b. real output and the price level both fell. Oc real output fell and the price level rose. d. real output and the price level both rose.
Q: Refer to the attached figure. The dollar is currently at Point A. A depreciation of the Euro causes…
A: The exchange rate measures the value of one nation's currency in terms of another nation's currency.…
Q: What is the "rivalry" and "excludability" of the following goods? Also, if applicable, are they…
A: A good is consumed by an individual in an economy. These goods give some utility to the consumers by…
Q: Which of the following is true about the free rider problem OA. It's a situation where the benefits…
A: Free Rider Problem:The free rider problem refers to a situation in which individuals benefit from a…
Q: price elasticity of supply between points A and B
A: The following formula must be used to determine the price elasticity of supply between places A and…
Q: What is the of the measures of the monetary aggregates is composed of the most liquid assets
A: Monetary aggregates refer to various categories of money supply in an economy, typically classified…
Q: An end-of-alste price promotion changes the price elasticity of a good from -2 to -3. Suppose the…
A: Before the promotional offer:Price = $28. Price elasticity of demand (Ed) = -2The price is $28, MR =…
Q: Which of the following would be included in GDP, the purchase of staplers from Staples by a car…
A: GDP represents the total monetary value of all final goods and services produced within a country…
Q: A solid-waste recycling plant is considering two types of storage bins. Use ROR evaluation and an…
A: The incremental rate of return shows the rate of return that will be earned because of incurring…
Q: a. What is the value of AC at economic capacity in each of the three plants? Plant 1: Plant 2: Plant…
A: Economic capacity refers to the level of production where average costs (AC) are minimized. Looking…
Q: The shift of the production possibilities frontier from A to B in the figure above illustrates a.…
A: Production possibility frontier depicts the combination of two goods that can be produced by using…
Q: PRICE (Dollars perton) 8 81 72 63 54 45 30 27 18 9 0 Demand 020 40 60 80 100 120 140 160 180 200…
A: Correcting negative externalities involves implementing policies such as taxation, subsidies, and…
Q: 31. نه ل ل ت م م a. b. C If US GDP exceeds US GNP, then intermediate production exceeds final…
A: ***Since the student has posted multiple questions, the expert is required to solve only the first…
Q: The marginal utility of additional units of a product tends to: Go up Go down Remain constant There…
A: Utility refers that wants satisfying power of the commodity , different people gets different…
Q: 3. If the exchange rate changes from 1.50 Canadian dollars per U.S. dollar to 1.67 Canadian dollar…
A: The exchange rate between Canadian dollars and US dollars is 1.50 Canadian $ per US $. It changes to…
Q: 4. Minimum wage legislation The following graph gives the labor market for the fast-food industry of…
A: The labour market is a high priority in both micro and macroeconomics because it has the possibility…
Q: Exhibit 6-13 Cost curves In Exhibit 6-13, ATC is shown by the graph labeled: O a. V. KERKE Q b. I. O…
A: The Average Total Cost (ATC) curve is a graphical representation of the average cost per unit of…
Q: Discuss the measures of the monetary aggregates that is composed of the most liquid asset
A: The monetary aggregates refer to monetary measures. Typically, the monetary measures are divided…
Q: The diagram depicts the market for home fuel oil, which is used to heat homes and buildings. If…
A: Demand refers to the consumer's willingness to buy a product at particular price level at a moment.A…
Q: isted below, determine what happens to the equilibrium price and equilibrium quantity for each…
A: Demand curve depicts the inverse relationship between price and quantity demanded of a product,…
Q: The source for this dataset is The World Bank. data.worldbank.org/indicator/NY.GDP.PCAP.CD (a) In…
A: (a) According to the dataset from The World Bank, the six richest countries in the world in 2022…
Q: b. True or False. "A rational consumer will purchase only 1 unit of the product represented by these…
A: Consumers strive to optimize their satisfaction by picking products or services that align with…
Q: Select and define in detail eight of the following economic terms: surplus intermediaries deficit…
A: Intermediaries:Intermediaries are entities or individuals that facilitate transactions between two…
Q: Deriving the aggregate demand curve from the quantity equation of money allows the aggregate demand…
A: The quantity equation of money is given by MV=PY; where:M- money supplyV- velocity of moneyP-…
Q: Ike's Bikes is a major manufacturer of bicycles. Currently, the company produces bikes using only…
A: Ike's Bikes is a bicycle manufacturer. Currently uses only one factory to manufacture bicycles.…
Q: PRICE (Dollars per room) 450 400 350 300 250 200 150 100 50 0 Demand 0 50 100 150 200 250 300 350…
A: Demand refers to the quantity of a good or service that consumers are willing and able to purchase…
Q: Find the equivalent present worth of the following cash flow if i = 10% (compounded annually). 0 2…
A: In the given diagram, the cash outflow series from the 4th year to 10 year follows a uniform…
Q: Real rate of interest does not change with maturity. Is that right
A: The nominal interest rate refers to that which is quoted by a financial institution or lender…
Q: a) On the graph to the right, use the line drawing tool to draw the total cost curve for each option…
A: A total cost curve is a graph that represents the total costs of production as a function of the…
Q: Herriott's is the only veterinary clinic in a remote village. The firm's total fixed cost is $300 a…
A: Herriott's is the only veterinary clinic so this clinic has the monopoly in the remote village. This…
Q: Thompson Mechanical Products is planning to set aside $150,000 now for possible replacement of large…
A: Future value is the value of the investment after a certain period of time at particular interest…
Q: RATE of GROWTH of Aggregate output (Y) is calculated as Percentage Change in RGDP =Y:
A: Aggregate output is the total value of goods and services produced in an economy during a certain…
Q: Factor price (S) 11 10 9 65 0 $210; $1 $6; $2 $16, $2 $120:-$2 10 57:51 20 shown below apply to a…
A: Economic profit, also known as pure profit or supernormal profit, is a measure of a company's…
Q: If supply is S2, which area represents MARKET surplus?
A: The Consumer surplus is defined as area of triangle that lies below the demand curve and above the…
Q: Suppose the government increases expenditures by $100 billion and the marginal propensity to consume…
A: The Marginal Propensity to Consume is a measure in economics that represents the proportion of an…
Q: 12. Developing countries might be unable to respond smoothly to changing international price signals…
A: Developing nations, additionally frequently alluded to as lower-income nations or the Global South,…
Q: Consider graph PPC2 above. Assume the initial PPC has intercepts at points F and E. What might cause…
A: A curve that illustrates the most goods and services (here, capital and consumer goods) an economy…
Q: The residential division of Prism’s high-speed Internet service uses one advertising agency, while…
A: Selection bias:Selection bias occurs when the sample used in a study is not representative of the…
Q: Suppose we have the following scenario: Multiplier: 1.2 Tax Rate: 16% Increase in spending: $175…
A: Change in budget deficit = Change in government expenditure - Change in tax revenueChange in tax…
Q: Demand Factor Average American household income Roundtrip airfare from New Orleans (MSY) to Atlantic…
A: Demand refers to the quantity of a good or service that consumers are willing and able to purchase…
Q: Q1. The cash-flow diagram on the left-hand side of the diagram below is transformed into an…
A: An equivalent annual annuity helps to determine the amount to be paid or received each year for a…
Q: Based on the game depicted in the matrix below, which of the following is true: Player 1 U M D L 4,3…
A: A dominant strategy is the one that a player always plays irrespective of what the other player…
Q: Price ($) 432MOSS 4321 14 13 12 11 10 9 8 7 6 5 20 40 60 80 100 120 140 Graph A Binelastic; Graph B…
A: Elasticity of demand is a measure of how responsive the quantity demanded of a good is to a change…
Q: Suppose that Martha’s income is $40,000 per year. She can spend it on health care visits, which cost…
A: Utility maximization problem: With the given prices and the income, a consumer chooses his…
Q: ) A consumer with income I=120 facing prices pX = 4 and pY = 8 for two goods X and Y (for each good…
A: The marginal rate of substitution (MRS) is a concept in economics that measures the rate at which a…
Q: 31) Suppose in 2017 you buy two year $1,000 face-value 5% coupon bond for $1,000. In 2018, interest…
A: Coupon rate refers to the rate of interest paid by bond issuers on the bond’s face value. coupon…
Q: The diagram to the right is a basic supply and demand graph. Economists use it to analyze…
A: A price floor is imposed in a market above the equilibrium price level, it a price regulation by the…
Q: The free-rider problem occurs when: Select an answer and submit. For keyboard navigation, use the…
A: Free Rider problem is a kind of market failure when people use the or take the benefit from…
Q: Consider a buyer whose valuation for successive units of a good is as follows. q V(q) MV(q) 0$0 –…
A: Marginal valuation, in economics, implies the additional value or utility that an individual or firm…
Q: Donovan would like to build a game room in his basement but does not want to take a loan. He opens…
A: Future Value is based on an assumed rate or growth in value of an investment or asset over…
Q: 1. Define the concept of constant returns to scale. 2. Why does it make economic sense to assume…
A: CRS is an economic concept that describes a situation where a proportional increase in the inputs…
Trending now
This is a popular solution!
Step by step
Solved in 3 steps with 2 images
- Assume that in Berberistan only three goods are produced: coffee, tea, and cheesecake. The table below shows the prices and quantities of the three goods in 2018, 2019 and 2020. (Take 2018 as the base year when necessary) 2018 2019 2020Quantity price quantity Price quantity PriceCoffee 2 20 6 10 5 12Tea 20 2 20 2 25 3Cheesecake 15 8 10 10 15 5a) What is the nominal GDP in 2019. b) What is the nominal GDP in 2020. c) What is the real GDP in 2019.d) What is the real GDP in 2020.e) What is the real economic growth from 2019 to 2020.First, define nominal GDP and real GDP. Second, is it possible for nominal GDP in a year to be less than real GDP in the same year? Explain. (100 words max)Suppose an economy produces only burgers and bags of fries. In 2010, 4000 burgers are sold at $3 each and 6000 bags of fries are sold at $1.50 each. In 2008, the base year, burgers sold for $2.50 each and bags of fries sold for $2 each. a. nominal GDP is $22,000, real GDP is $21,000, and the GDP deflator is 95.45. b. nominal GDP is $22,000, real GDP is $21,000, and the GDP deflator is 104.77. c. nominal GDP is $21,000, real GDP is $22,000, and the GDP deflator is 95.45. d. nominal GDP is $21,000, real GDP is $22,000, and the GDP deflator is 104.77.
- Consider an economy that only produces the two goods of Pizza and Calzones. What is Nominal GDP if 10 Calzones are sold at $20 each and 5 pizzas are sold at $100 each ? A. $100 B. $500 C. $700 D. $1,300 E. $900When nominal GDP rises, we can be certain that... a) prices must have risen b) both prices and quantities of goods and services must have risen c) quanties of goods and services produced must have risen d) either prices or quantites of goods and services must have risenConsider an economy that produces only chocolatebars. In year 1, the quantity produced is 3 barsand the price is $4 per bar. In year 2, the quantityproduced is 4 bars and the price is $5 per bar.In year 3, the quantity produced is 5 bars and theprice is $6 per bar. Year 1 is the base year.a. What is nominal GDP for each of these three years?b. What is real GDP for each of these years?c. What is the GDP deflator for each of these years?d. What is the percentage growth rate of real GDPfrom year 2 to year 3?e. What is the inflation rate as measured by the GDPdeflator from year 2 to year 3?f. In this one-good economy, how might you haveanswered parts (d) and (e) without first answeringparts (b) and (c)?
- Consider the following data on Prices and Quantities of T-Shirts and Pajamas. Year Price of T-Shirts Quantity of T-Shirts Price of Pajamas Quantity of Pajamas 2015 $10 120 $12 200 2016 $12 300 $15 200 2017 $14 275 $18 180 Calculate the total value of goods and services at current prices in this economy each year? Calculate the total value of goods and services at constant prices in this economy each year? (Note: GDP deflator for 2015 is 100) What is the growth rate of Rea lGDP between 2016and 2017? What was the growth rate of Nominal GDP between 2016 and 2017?Harry's Pepperoni Pizza Parlor produced 10,000 large pepperoni pizzas last year that sold for $10 each. This year Harry's produced 9,000 large pepperoni pizzas (identical to last year's pizzas) but sold them for $15 each. Based on this information, we can conclude that Harry's production of large pepperoni pizzas Multiple Choice increased nominal GDP by $35,000. did not change nominal GDP. increased real GDP by $35,000. did not change real GDP. please help me and give me best explanation thankuBelow are some data from the land of milk and honey a) Compute nominal GDP, real GDP, and the GDP deflator for each year, using 2017 as the base year. Hints: show steps. b) Compute the percentage change in nominal GDP, real GDP, and the GDP deflator in 2018 and 2019 from the preceding year. For each year, identify the variable that does not change. Explain in words why your answer makes sense. Hints: show steps. c) Did economic well-being rise more in 2018 or 2019? Explain.
- a) Consider an economy that produces only chocolate bars. In year 1, the quantity producedis 3 bars and the price is $4. In year 2, the quantity produced is 4 bars and the price is $5.In year 3, the quantity produced is 5 bars and the price is $6. Year 1 is the base year.i. What is nominal GDP for each of these three years?ii. What is real GDP for each of these years?iii. What is the GDP deflator for each of these years?iv. What is the percentage growth rate of real GDP from year 2 to year 3?v. What is the inflation rate as measured by the GDP deflator from year 2 to year 3?The following table shows the outputs and prices of three products A, B and C by a small economy in 2019, 2020 and 2021. 2019 2020 2021 Product price qty price qty price qty A $4 50 $5 55 $6 60 B $3 40 $5 42 $8 45 C $2 20 $3 25 $4 28 (A) Compute the nominal GDP, the real GDP and the GDP deflator in 2020 and 2021, taking 2019 as the base year. Using the GDP deflator, measure the inflation rate in the economy between 2019 and 2020, and also between 2020 and 2021. (B) A typical household consumes 3 units of A, 3 units of B and 2 units of C in 2019. Using 2019 as the base year, compute the CPI for 2020 and 2021 and the inflation rate between 2019 and 2020, and also between 2020 and 2021. Are the inflation rates computed from (b) the same as those computed from (a)? Why?you inherited the company, --let’s called is U-- that owns the land growing the trees and you sell your cut down trees to Company V for $30,000. Company V converts your trees into logs and sells them further down the industry supply chain. Think about the impact of this transaction between Company U and Company V on increasing the GDP. Which one of the parts of the GDP formula does this $30,000 transaction increase: C, I, G, X, or I? Correctly identify which one increases GDP and why you chose that part of the GDP impacted.