A dataset from 1987 contains information about credit card applications and approvals for 690 applicants. We are interested in looking at the amount of debt across industries, specifically between information technology, healthcare, real estate, and education. The following values are scaled down for ease of analysis. From the sample, 45 are in information technology with an average of $4.03 dollars in debt and a standard deviation of $3.88. 52 are in the healthcare industry with an average of $5.84 dollars in debt and a standard deviation of $6.58. 30 are in real estate with an average of $4.79 dollars in debt and a standard deviation of $5.43. 30 are in education with an average of $8.21 dollars in debt and a standard deviation of $6.25. Fill in the hypotheses below: Ho: All the means are equal. Ha: At least one mean is different from the others. Part 2 of 3 Complete the following ANOVA summary table (a = 0.01). Round your answers to three decimal places, if necessary, and round any interim calculations to four decimal places. What is the overall mean? Use this as a check before you begin your calculations. Source Between Within Total SS df MS F P-value
A dataset from 1987 contains information about credit card applications and approvals for 690 applicants. We are interested in looking at the amount of debt across industries, specifically between information technology, healthcare, real estate, and education. The following values are scaled down for ease of analysis. From the sample, 45 are in information technology with an average of $4.03 dollars in debt and a standard deviation of $3.88. 52 are in the healthcare industry with an average of $5.84 dollars in debt and a standard deviation of $6.58. 30 are in real estate with an average of $4.79 dollars in debt and a standard deviation of $5.43. 30 are in education with an average of $8.21 dollars in debt and a standard deviation of $6.25. Fill in the hypotheses below: Ho: All the means are equal. Ha: At least one mean is different from the others. Part 2 of 3 Complete the following ANOVA summary table (a = 0.01). Round your answers to three decimal places, if necessary, and round any interim calculations to four decimal places. What is the overall mean? Use this as a check before you begin your calculations. Source Between Within Total SS df MS F P-value

Glencoe Algebra 1, Student Edition, 9780079039897, 0079039898, 2018
18th Edition
ISBN:9780079039897
Author:Carter
Publisher:Carter
Chapter10: Statistics
Section10.6: Summarizing Categorical Data
Problem 10CYU

Related questions
Question
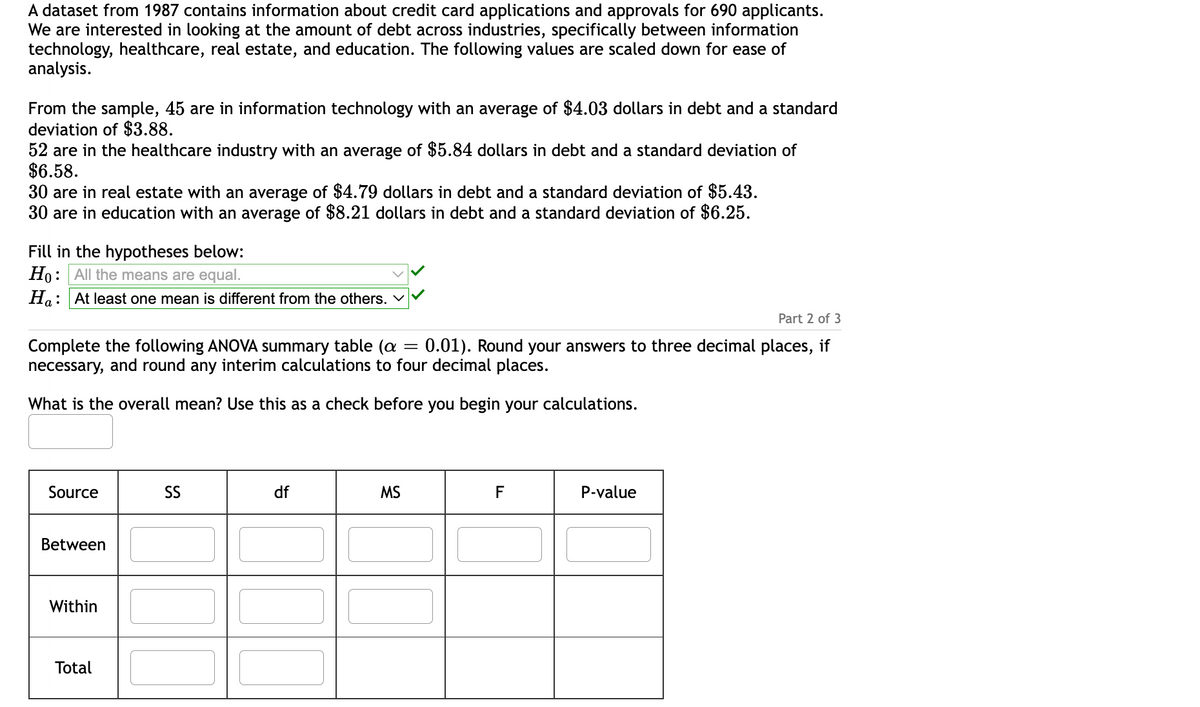
Transcribed Image Text:A dataset from 1987 contains information about credit card applications and approvals for 690 applicants.
We are interested in looking at the amount of debt across industries, specifically between information
technology, healthcare, real estate, and education. The following values are scaled down for ease of
analysis.
From the sample, 45 are in information technology with an average of $4.03 dollars in debt and a standard
deviation of $3.88.
52 are in the healthcare industry with an average of $5.84 dollars in debt and a standard deviation of
$6.58.
30 are in real estate with an average of $4.79 dollars in debt and a standard deviation of $5.43.
30 are in education with an average of $8.21 dollars in debt and a standard deviation of $6.25.
Fill in the hypotheses below:
Ho: All the means are equal.
Ha: At least one mean is different from the others. ✓
Part 2 of 3
Complete the following ANOVA summary table (a = 0.01). Round your answers to three decimal places, if
necessary, and round any interim calculations to four decimal places.
What is the overall mean? Use this as a check before you begin your calculations.
Source
Between
Within
Total
SS
df
MS
F
P-value
Expert Solution
This question has been solved!
Explore an expertly crafted, step-by-step solution for a thorough understanding of key concepts.

Step by step
Solved in 2 steps with 2 images

Recommended textbooks for you
Glencoe Algebra 1, Student Edition, 9780079039897…
Algebra
ISBN:
9780079039897
Author:
Carter
Publisher:
McGraw Hill

Holt Mcdougal Larson Pre-algebra: Student Edition…
Algebra
ISBN:
9780547587776
Author:
HOLT MCDOUGAL
Publisher:
HOLT MCDOUGAL

College Algebra (MindTap Course List)
Algebra
ISBN:
9781305652231
Author:
R. David Gustafson, Jeff Hughes
Publisher:
Cengage Learning
Glencoe Algebra 1, Student Edition, 9780079039897…
Algebra
ISBN:
9780079039897
Author:
Carter
Publisher:
McGraw Hill
Holt Mcdougal Larson Pre-algebra: Student Edition…
Algebra
ISBN:
9780547587776
Author:
HOLT MCDOUGAL
Publisher:
HOLT MCDOUGAL
College Algebra (MindTap Course List)
Algebra
ISBN:
9781305652231
Author:
R. David Gustafson, Jeff Hughes
Publisher:
Cengage Learning