fllustration 12.11. Given below are the figures of production in thousand quintals of a sugar factory. Year 1964 1965 1966 1967 1968 1969 1970 Production 77 88 94 85 91 98 90 (i) Fit a straight line trend by the 'least square' method. Tabulate the trend values. (ii) What is the monthly increase in production?
fllustration 12.11. Given below are the figures of production in thousand quintals of a sugar factory. Year 1964 1965 1966 1967 1968 1969 1970 Production 77 88 94 85 91 98 90 (i) Fit a straight line trend by the 'least square' method. Tabulate the trend values. (ii) What is the monthly increase in production?

Chapter3: Functions
Section3.3: Rates Of Change And Behavior Of Graphs
Problem 27SE: Table 4 gives the population of a town (in thousand) from 2000 to 2008. What was the average rate of...

Related questions
Question
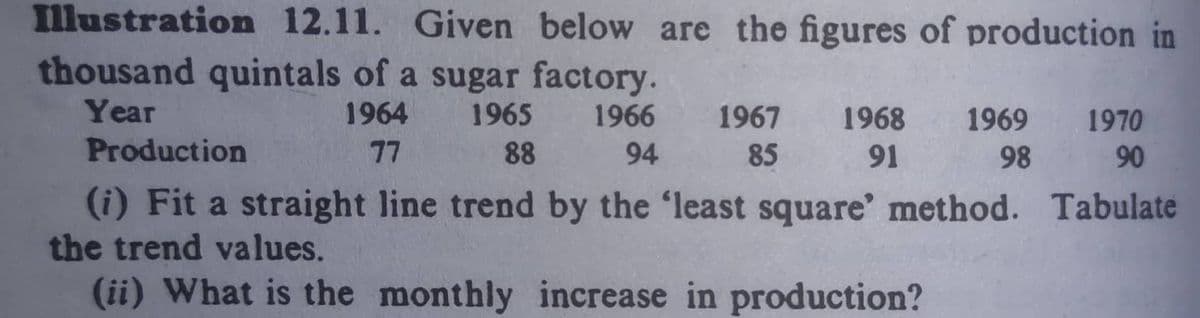
Transcribed Image Text:Illustration 12.11. Given below are the figures of production in
thousand quintals of a sugar factory.
Year
1964
1965
1966 1967
1968
1969
1970
Production
77
88
94
85
91
98
90
(i) Fit a straight line trend by the 'least square' method. Tabulate
the trend values.
(ii) What is the monthly increase in production?
Expert Solution
This question has been solved!
Explore an expertly crafted, step-by-step solution for a thorough understanding of key concepts.

Step by step
Solved in 2 steps with 2 images

Recommended textbooks for you

College Algebra (MindTap Course List)
Algebra
ISBN:
9781305652231
Author:
R. David Gustafson, Jeff Hughes
Publisher:
Cengage Learning

Glencoe Algebra 1, Student Edition, 9780079039897…
Algebra
ISBN:
9780079039897
Author:
Carter
Publisher:
McGraw Hill
College Algebra (MindTap Course List)
Algebra
ISBN:
9781305652231
Author:
R. David Gustafson, Jeff Hughes
Publisher:
Cengage Learning
Glencoe Algebra 1, Student Edition, 9780079039897…
Algebra
ISBN:
9780079039897
Author:
Carter
Publisher:
McGraw Hill