(a) Estimate control limits (CL), upper control limits (UCL) and lower control limits (LCL). (b) Establish a control chart. (c) Is the process under control?
Q: Make a stemplot to display the distribution of pups born per year. Describe the shape, center, and…
A: The objective is to make a stemplot for the data:
Q: The following observations are for two quantitative variables, x and y. Observation Observation…
A: Given Information: Consider the given data: Observation x y 1 21 61 2 13 89 3 57 56 4 82…
Q: The probability a machine has a lifespan of more than 5 years is 0.8. Ten machines are chosen at…
A: given data probability of lifespan more than 5 years = p = 0.8 n = 10 machines selected x = no. of…
Q: We are planning an experiment comparing three fertilizers. We will have six experimental units per…
A: The formula of the sample size is,
Q: How many factors are in this scenario? For each clearly labeled factor, state how many levels it has…
A: From given data : we have the the variables study condition and test type
Q: Suppose that the time required to complete a 1040R tax form is normal distributed with a mean of 100…
A: Let X denote the time required to complete a 1040R tax form. Given that X follows N(mean = 100, SD =…
Q: Suppose you roll 10 4-sided dice. (a) What are the odds the sum is 10? (b) What are the odds the sum…
A:
Q: Here is a data set: 20 22 22 39 37 43 33 38 39 45 31 27 26 30 53 32 20 36 56 32 30 38 29 55 37 43 41…
A: Data given 20,22,22,39,37 43,33,38,39,45 31,27,26,30,53 32,20,36,56,32 30,38,29,55,37 43,41,43,21,32…
Q: The number of different ways that the letters of "balloon" can be arranged is. (Type an integer or a…
A: There are 7 letters in the word BALLOON where L occurs 2 times and O occurs 2 times so, Total…
Q: How many different 10-letter words (real or imaginary) can be formed from the following letters? K,…
A: The question is about permutation Given : No. of letters in words ( n ) = 10 No. of times " K "…
Q: Suppose that blood chloride concentration (mmol/L) has a normal distribution with mean 108 and…
A: Given that Population mean =108 Standard deviation =5 We have to find a..P(X=109) P(X<109)…
Q: Use inductive reasoning to predict the next line in the sequence of computations. Then use a…
A: Given Sequence is: 333*333667=111111111 666*333667=222222222 999*333667=333333333…
Q: d) How many girls не or e) What proportion of the girls in the study ate 2 servings of fruit per…
A: Hi there! Since the first three parts are already solved correctly, we will solve the remaining…
Q: The table below gives the list price and the number of bids received for five randomly selected…
A: The independent variable is price in dollars. The dependent variable is number of bids. This is…
Q: Let 8 = (B, o^2 )^T denotes the unknown parameters for multiple linear regression. Find the…
A: Given information : Let θ=(β,σ2)T which denotes the unknown parameter of the multiple regression…
Q: What is the unit of observation in the dataset? A) The UK B) British Pound Sterling C) A person that…
A: given:The given survey is the smoking habits of the UK residents
Q: A doctor's office staff studied the waiting times for patients who arrive at the office with a…
A:
Q: [Continuous Uniform Law] Rami calls you and Sara and says he is giving his bike away to whomever…
A: a) Consider X and Y represent the time in minutes the individual and Sara took, to go to Rami to get…
Q: Find the equation of the line .that best fits, in the least squares sense, the data in the following…
A: Given data is : We have to find Fit a line using least square sense
Q: 5. High school textbooks don't last forever. The lifespan of all high school textbooks is…
A: Given that: Mean, μ=9 years Population standard deviation, σ=2.5 years
Q: Consider a random variable that has a uniform distribution over 32 outcomes. find the average of…
A:
Q: 1. A researcher is interested in choice and decisions. He looks at what people buy for lunch in a…
A: Since you have asked multiple questions, we will solve the first question for you. If you want any…
Q: College students are randomly selected and arranged in groups of three. The random variable x is the…
A:
Q: Consider a set of equity returns from four different markets across 12 different periods. The data…
A: Since we only answer up to 3 sub-parts, we’ll answer the first 3. Please resubmit the question and…
Q: =y 3 5
A: The given data is Low Temperature Frequency 40-44 3 45-49 5 50-54 9 55-59 4 60-64 1
Q: For the binomial distribution, which formula finds the standard deviation? Choose the correct answer…
A: Given X~Bin(n,p)
Q: Suppose that blood chloride concentration (mmol/L) has a normal distribution with mean 106 and…
A: Given: Population mean μ=106 Population standard deviation σ=2
Q: Company A produces 10% def Company B produces 20% def and C produces 5% defective choosing a company…
A: Company A produces 10% defective product. Company B produces 20% defective product. Company C…
Q: For a binomial distribution, the parameters are n = 10 and q = 0.3. Then, i) Find mean ii) Find…
A:
Q: You are designing a road system leading to a city. There are 9 lights on the road and the…
A: Road 1 = 9 lights Probability that a light is red = 0.3 Another road 2 = 8 lights We have to answer…
Q: The number of observers in the Frogwatch USA program (a wildlife conservation program dedicated to…
A: 1) We have to Calculate Mean, Median, Mode from the following…
Q: IV. The table below shows the number of students who visit the library per day. X 30 45 52 55 60 16.…
A: Since you have posted a question with multiple sub-parts, we will solve first three subparts for…
Q: If mean of a skewed distribution is 170 and mode is 158 , and standard deviation is 48 find…
A:
Q: You are designing a road system leading to a city. There are 9 lights on the road and the…
A:
Q: Which word is associated with multiplication when computing probabilities? Choose the correct answer…
A: For the given options, we need to answer which word is associated with multiplication when…
Q: 5. High school textbooks don't last forever. The lifespan of all high school textbooks is…
A: From the provided information, Mean (µ) = 9 Standard deviation (σ) = 2.5
Q: rtune magazine reported the results of a survey on executive training that was conducted by the…
A:
Q: And from this solution, what percentage of times are between 22 & 46 minutes? What percentage is…
A: Given that Population mean=34 minutes Standard deviation =6 minutes We have to find the percentage…
Q: Suppose a sample of 100 customers buys an average of 3.2 items with a standard deviation of 7.4.…
A: We have given that Sample standard deviations (s) = 7.4 Sample size (n) = 100 Average or Mean =…
Q: To assess how women are doing in the workforce, we have gathered data from 120 firms with 100 to 500…
A: Given: Sample size n = 120 Sample proportion p^ = 0.5093 Formula Used: Lower bound of the confidence…
Q: K Use the pie chart at the right, which shows the number of workers (in thousands) by industry for a…
A: P(Worker not employed in Agriculture forestry, fishing, and hunting) = 0.981 Explanation:
Q: K According to Bayes' Theorem, the probability of event A, given that event B has occurred, is as…
A: The solution is as shown below Explanation:
Q: Example 3. (b) From the following data find out the standard deviation 10-20 30-40 10 15 X: f: 20-30…
A:
Q: Q1. A restaurant owner is interested in the proportion of his customers who order dessert. He looks…
A: “Since you have asked multiple questions, we will solve the first question for you. If you want any…
Q: Three transistors are tested. The probability that none of them works is 0.97. What is the…
A:
Q: Quality Progress, February 2005, reports on improvements in customer satisfaction and loyalty made…
A:
Q: Does amount of caffeine affect memory? This study was conducted using 30 participants who report…
A: Given situation: Claim: Does amount of caffeine affect memory?. There are three caffeine conditions:…
Q: g-Find the 95% prediction interval for the 95oF average daily temperature
A: From previous parts of question we have the following information The standard error of the estimate…
Q: Example 1. Find Range and Coefficient of Range for following data. 18 19 21 23 25 27 29 14 33 34 37
A:
Q: The power spectral density at zero frequency is equal to the area under the curve of the…
A:
pls answer b with some explanation tq
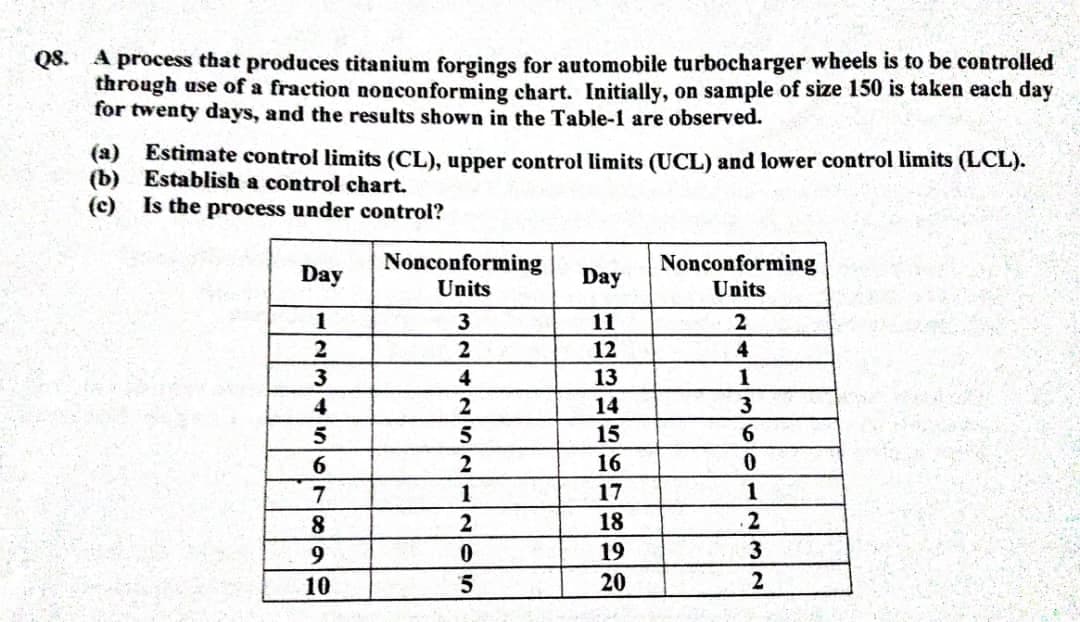
Step by step
Solved in 4 steps with 2 images
- If you have a sample size of 50 and you are comparing 3 groups at the .05 level- what is the critical F value?Q2 Based on your graphical and numerical analysis in Q1, which method - 1.5(IQR) or 3(SD) is more appropriate to remove outliers from the departure delay variable? Remove outliers for departure delay with the appropriate method. Store this new dataset as 'no_out_dd. You'll want to use this new dataset without outliers for use in Q3. What proportion of rows remains following the removal process multiple times. Can you please show how to do this in R Studio?The control limits for a 3-sigma c chart with n=2 when the process average is equal to 8 nonconformities for one inspection unit are Select one: a. LCL=0 UCL=16.5 b. LCL=-0.5 UCL=16.5 c. LCL=4 UCL=28 d. LCL=0 UCL=28 e. LCL=-4 UCL=28
- over several weeks of normal, or in-control, operation, 20 samples of 150 packageseach of synthetic-gut tennis strings were tested for breaking strength. A total of 141packages of the 3000 tested failed to conform to the manufacturer’s specifications.a. what is an estimate of the process proportion defective when the system is in control?b. Compute the upper and lower control limits for a p chart.c. with the results of part (b), what conclusion should be made about the process if testson a new sample of 150 packages find 12 defective? Do there appear to be assignablecauses in this situation?d. Compute the upper and lower control limits for an np chart.e. Answer part (c) using the results of part (d)over several weeks of normal, or in-control, operation, 20 samples of 150 packageseach of synthetic-gut tennis strings were tested for breaking strength. A total of 141packages of the 3000 tested failed to conform to the manufacturer’s specifications.a. what is an estimate of the process proportion defective when the system is in control?b. Compute the upper and lower control limits for a p chart.c. with the results of part (b), what conclusion should be made about the process if testson a new sample of 150 packages find 12 defective? Do there appear to be assignablecauses in this situation?d. Compute the upper and lower control limits for an np chart.e. Answer part (c) using the results of part (d).f. which control chart would be preferred in this situation? Explain.over several weeks of normal, or in-control, operation, 20 samples of 150 packageseach of synthetic-gut tennis strings were tested for breaking strength. A total of 141packages of the 3000 tested failed to conform to the manufacturer’s specifications.a. what is an estimate of the process proportion defective when the system is in control?b. Compute the upper and lower control limits for a p chart.c. with the results of part (b), what conclusion should be made about the process if testson a new sample of 150 packages find 12 defective? Do there appear to be assignablecauses in this situation?
- 2.) Listed below are the number of Atlantic hurricanes occurring in each year. The data are listed inchronological order starting with the year 2000.8 9 4 7 9 15 5 6 8 3 12 7 10 2 6 4 d.) Are there any values that would be considered “significantly” or “unusually” high or low? Why?e.) Based on the definition of outlier involving the interquartile range, are there any outliers in thesample? Why?A potato chip company produces a large number of potato chip bags each day and wants to investigate whether a new packaging machine will lower the proportion of bags that are damaged. The company selected a random sample of 150 bags from the old machine and found that 15 percent of the bags were damaged, then selected a random sample of 200 bags from the new machine and found that 8 percent were damaged. Let pˆOp^O represent the sample proportion of bags packaged on the old machine that are damaged, pˆNp^N represent the sample proportion of bags packaged on the new machine that are damaged, pˆCp^C represent the combined proportion of damaged bags from both machines, and nOnO and nNnN represent the respective sample sizes for the old machine and new machine. Have the conditions for statistical inference for testing a difference in population proportions been met? No, the condition for independence has not been met, because random samples were not selected. A No, the…1.State why the median is reliable to report as the middle value of the data than the mean when there are outliers in the data. 2.comment on the kurtosis coefficient 3.010 and 6.342
- A student decides to spin a dime and determine the proportion of times it lands on heads. The student spins the dime 25 times and records that it lands on heads 17 times. Let p = the true proportion of times the dime would land on heads when spun. Under the assumption that the true proportion is 0.5, 100 simulated proportions for samples of size 25 is shown in the dotplot. Using the dotplot, is there evidence that the proportion of times a spun dime lands on heads is greater than 0.5? A) Yes, a proportion of 0.68 proves that the true proportion of heads is greater than 0.5. B) Yes, a proportion of 0.68 only occurred once out of 100 simulated proportions; therefore, there is sufficient evidence that the true proportion of heads is greater than 0.5. C) No, a proportion of 0.68 is only 0.18 more than 0.5; therefore, there is insufficient evidence that the true proportion of heads is greater than 0.5. D) No, a proportion of 0.68 or more occurred 7 times out of 100 simulated…An investigation was conducted to determine the source of reduction in yield of a certainchemical product. It was thought that four different brands of a material may result indifferent yield reductions. The investigator assigned each brand of material randomly to 3of the 12 batches of production of the chemical product.The following are the results of the percent of yield reductions:Percent of yield reductionBrand 1 Brand 2 Brand 3 Brand 425.6 25.2 20.8 31.624.3 28.6 26.7 29.827.9 24.7 22.2 34.3 Assume that all assumptions to perform an ANOVA test are satisfied.a) Test the hypothesis that the four brands have the same percent of yield reduction atthe significance level, α = 0.05. Interpret the results of the hypothesis testing.b) Determine a 95% interval estimate for the percent of mean yield reduction of Brand3.c) Determine a 99% interval estimate for the difference in the percent of mean yieldreduction between Brands 4 and 3.The following table presents the number of active breweries for samples of states located east and west of the Mississippi River: Part:0/3Part 1 of 3 (a) Compute the sample standard devlation for the number of breweries east of the Mississippl River. Round the answer to one decimal place as needed The sample standard devlation for the number of brewenes east of the Mississippi River is