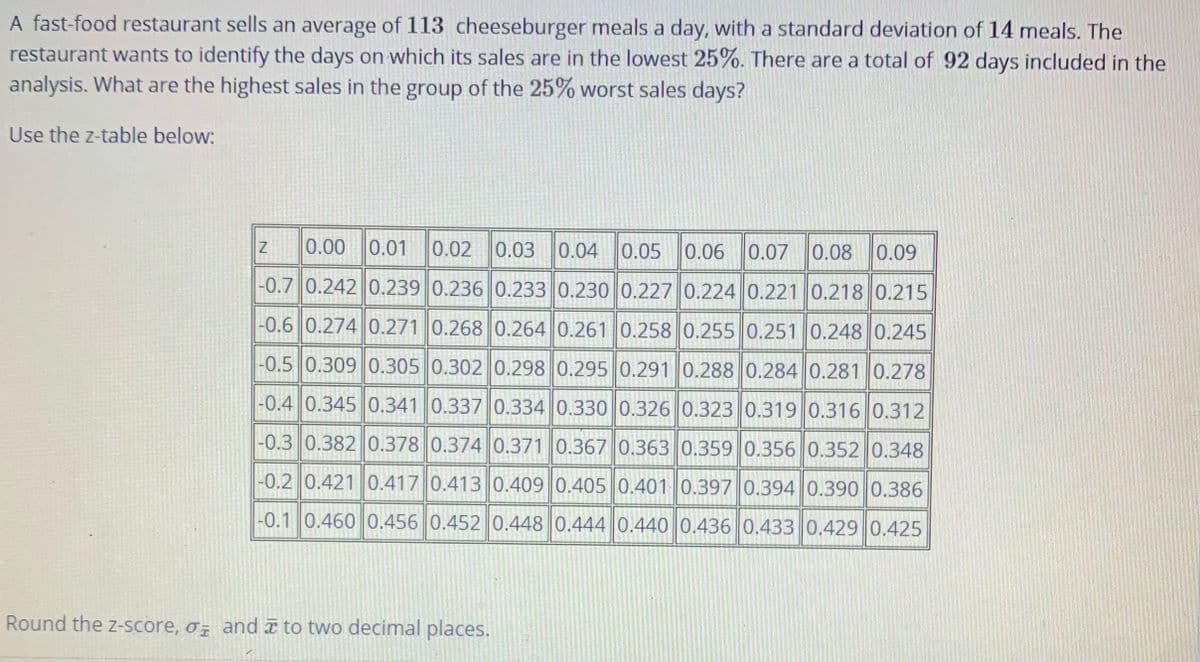
A fast-food restaurant sells an average of 113 cheeseburger meals a day, with a standard deviation of 14 meals. The restaurant wants to identify the days on which its sales are in the lowest 25%. There are a total of 92 days included in the analysis. What are the highest sales in the group of the 25% worst sales days? Use the z-table below: 0.00 0.01 0.02 0.03 0.04 0.05 0.06 0.07 0.08 0.09 -0.7 0.242 0.239 0.236 0.233 0.230 0.227 0.224 0.221 0.218 0.215 -0.6 0.274 0.271 0.268 0.264 0.261 0.258 0.255 0.251 0.248 0.245 -0.5 0.309 0.305 0.302 0.298 0.295 0.291 0.288 0.284 0.281 0.278 -0.4 0.345 0.341 0.337 0.334 0.330 0.326 0.323 0.319 0.316 0.312 -0.3 0.382 0.378 0.374 0.371 0.367 0.363 0.359 0.356 0.352 0.348 -0.2 0.421 0.417 0.413 0.409 0.405 0.401 0.397 0.394 0.390 0.386 -0.1 0.460 0.456 0.452 0.448 0.444 0.440 0.436 0.433 0.429 0.425 Round the z-score, o and to two decimal places.


Inverse Normal Distribution
The method used for finding the corresponding z-critical value in a normal distribution using the known probability is said to be an inverse normal distribution. The inverse normal distribution is a continuous probability distribution with a family of two parameters.
Mean, Median, Mode
It is a descriptive summary of a data set. It can be defined by using some of the measures. The central tendencies do not provide information regarding individual data from the dataset. However, they give a summary of the data set. The central tendency or measure of central tendency is a central or typical value for a probability distribution.
Z-Scores
A z-score is a unit of measurement used in statistics to describe the position of a raw score in terms of its distance from the mean, measured with reference to standard deviation from the mean. Z-scores are useful in statistics because they allow comparison between two scores that belong to different normal distributions.


Trending now
This is a popular solution!

Step by step
Solved in 2 steps


