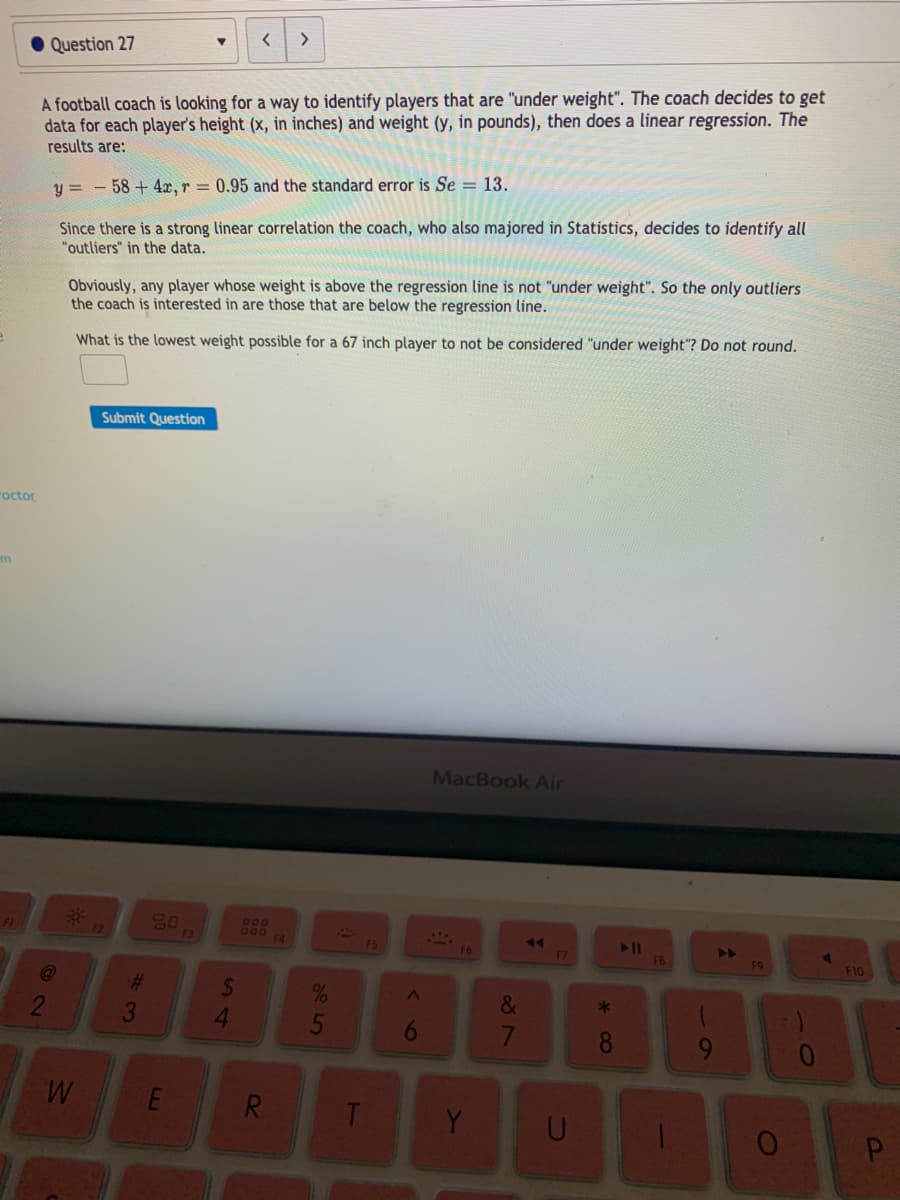
A football coach is looking for a way to identify players that are "under weight". The coach decides to get data for each player's height (x, in inches) and weight (y, in pounds), then does a linear regression. The results are: y = - 58+4x, r 0.95 and the standard error is Se = 13. %3D %3D Since there is a strong linear correlation the coach, who also majored in Statistics, decides to identify all "outliers" in the data. Obviously, any player whose weight is above the regression line is not "under weight". So the only outliers the coach is interested in are those that are below the regression line. What is the lowest weight possible for a 67 inch player to not be considered "under weight"? Do not round.

College Algebra
7th Edition
ISBN:9781305115545
Author:James Stewart, Lothar Redlin, Saleem Watson
Publisher:James Stewart, Lothar Redlin, Saleem Watson
Chapter1: Equations And Graphs
Section: Chapter Questions
Problem 10T: Olympic Pole Vault The graph in Figure 7 indicates that in recent years the winning Olympic men’s...
icon
Related questions
icon
Concept explainers
Question
Question 27
A football coach is looking for a way to identify players that are "under weight". The coach decides to get
data for each player's height (x, in inches) and weight (y, in pounds), then does a linear regression. The
results are:
y = - 58 + 4x, r = 0.95 and the standard error is Se = 13.
Since there is a strong linear correlation the coach, who also majored in Statistics, decides to identify all
"outliers" in the data.
Obviously, any player whose weight is above the regression line is not "under weight". So the only outliers
the coach is interested in are those that are below the regression line.
What is the lowest weight possible for a 67 inch player to not be considered "under weight"? Do not round.
Submit Question
octor
MacBook Air
80
O00
G00
F4
FL
F2
F3
F5
F6
F7
F9
F10
%23
&
*
4.
5
8
R.
Y
<6
SA
2
Transcribed Image Text:Question 27 A football coach is looking for a way to identify players that are "under weight". The coach decides to get data for each player's height (x, in inches) and weight (y, in pounds), then does a linear regression. The results are: y = - 58 + 4x, r = 0.95 and the standard error is Se = 13. Since there is a strong linear correlation the coach, who also majored in Statistics, decides to identify all "outliers" in the data. Obviously, any player whose weight is above the regression line is not "under weight". So the only outliers the coach is interested in are those that are below the regression line. What is the lowest weight possible for a 67 inch player to not be considered "under weight"? Do not round. Submit Question octor MacBook Air 80 O00 G00 F4 FL F2 F3 F5 F6 F7 F9 F10 %23 & * 4. 5 8 R. Y <6 SA 2
Expert Solution
steps

Step by step

Solved in 2 steps

Blurred answer
Knowledge Booster
Correlation, Regression, and Association
Learn more about
Need a deep-dive on the concept behind this application? Look no further. Learn more about this topic, statistics and related others by exploring similar questions and additional content below.
Recommended textbooks for you
College Algebra
College Algebra
Algebra
ISBN:
9781305115545
Author:
James Stewart, Lothar Redlin, Saleem Watson
Publisher:
Cengage Learning
Functions and Change: A Modeling Approach to Coll…
Algebra
ISBN:
9781337111348
Author:
Bruce Crauder, Benny Evans, Alan Noell
Publisher:
Cengage Learning
Glencoe Algebra 1, Student Edition, 9780079039897…
Algebra
ISBN:
9780079039897
Author:
Carter
Publisher:
McGraw Hill
Algebra and Trigonometry (MindTap Course List)
Algebra
ISBN:
9781305071742
Author:
James Stewart, Lothar Redlin, Saleem Watson
Publisher:
Cengage Learning