A frequency distribution is shown below. Complete parts (a) and (b). The number of televisions per household in a small town Televisions 1 3 Households 30 449 726 1401 (a) Use the frequency distribution to construct a probability distribution. P(x) 3. (Round to three decimal places as needed.) (b) Graph the probability distribution using a histogram. Choose the correct graph of the distribution below. OA. OB. Oc. APx) 0.6 0.5 AP) 0.6 AP) 0.6- 0.5 0.5
A frequency distribution is shown below. Complete parts (a) and (b). The number of televisions per household in a small town Televisions 1 3 Households 30 449 726 1401 (a) Use the frequency distribution to construct a probability distribution. P(x) 3. (Round to three decimal places as needed.) (b) Graph the probability distribution using a histogram. Choose the correct graph of the distribution below. OA. OB. Oc. APx) 0.6 0.5 AP) 0.6 AP) 0.6- 0.5 0.5

College Algebra
7th Edition
ISBN:9781305115545
Author:James Stewart, Lothar Redlin, Saleem Watson
Publisher:James Stewart, Lothar Redlin, Saleem Watson
Chapter9: Counting And Probability
Section9.3: Binomial Probability
Problem 16E: Probability Distribution An experiment is described. (a) Complete the table of the probability...

Related questions
Question
Transcribed Image Text:point(s) poSSIble
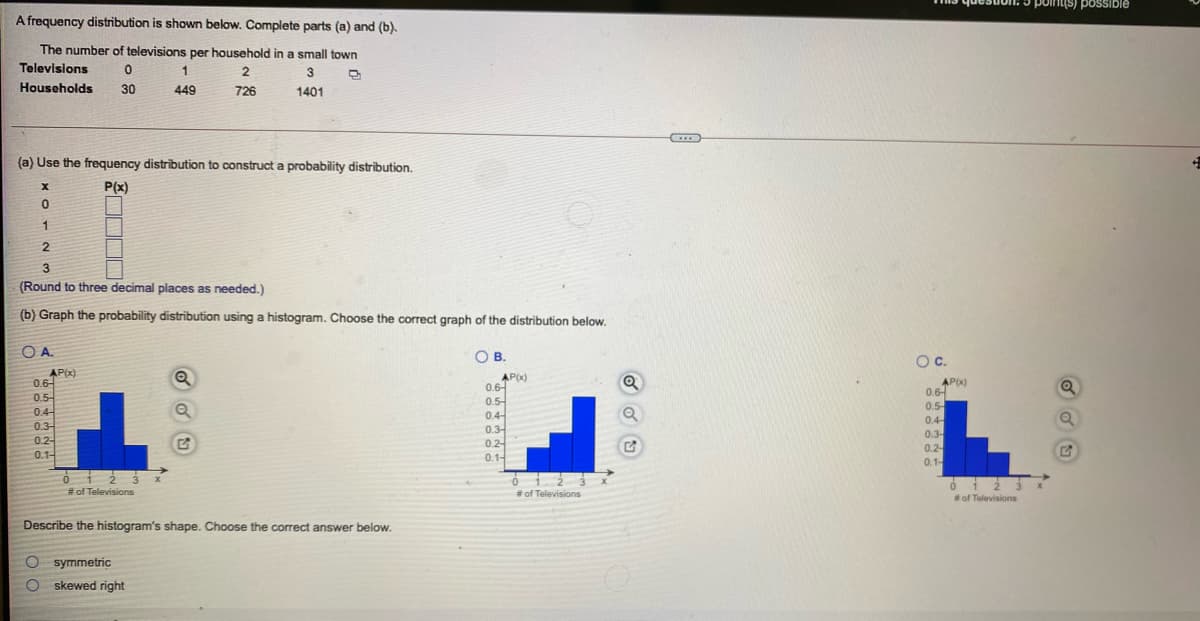
A frequency distribution is shown below. Complete parts (a) and (b).
The number of televisions per household in a small town
Televisions
1.
Households
30
449
726
1401
(a) Use the frequency distribution to construct a probability distribution.
P(x)
1
2.
3
(Round to three decimal places as needed.)
(b) Graph the probability distribution using a histogram. Choose the correct graph of the distribution below.
OA.
OB.
Oc.
AP(x)
0.6-
0.5
0.4-
0.3
AP(x)
0.6-
0.5-
0.4-
AP(x)
0.6-
0.5
0.4
0.3-
0.2-
0.3-
0.2-
0.2-
0.1-
0.1-
0.1-
# of Televisions
#of Televisions
#of Televisions
Describe the histogram's shape. Choose the correct answer below.
CO symmetric
O skewed right
Expert Solution
This question has been solved!
Explore an expertly crafted, step-by-step solution for a thorough understanding of key concepts.

Step by step
Solved in 3 steps with 1 images

Recommended textbooks for you
College Algebra
Algebra
ISBN:
9781305115545
Author:
James Stewart, Lothar Redlin, Saleem Watson
Publisher:
Cengage Learning

Holt Mcdougal Larson Pre-algebra: Student Edition…
Algebra
ISBN:
9780547587776
Author:
HOLT MCDOUGAL
Publisher:
HOLT MCDOUGAL

College Algebra
Algebra
ISBN:
9781305115545
Author:
James Stewart, Lothar Redlin, Saleem Watson
Publisher:
Cengage Learning
Holt Mcdougal Larson Pre-algebra: Student Edition…
Algebra
ISBN:
9780547587776
Author:
HOLT MCDOUGAL
Publisher:
HOLT MCDOUGAL

Algebra and Trigonometry (MindTap Course List)
Algebra
ISBN:
9781305071742
Author:
James Stewart, Lothar Redlin, Saleem Watson
Publisher:
Cengage Learning

Algebra & Trigonometry with Analytic Geometry
Algebra
ISBN:
9781133382119
Author:
Swokowski
Publisher:
Cengage