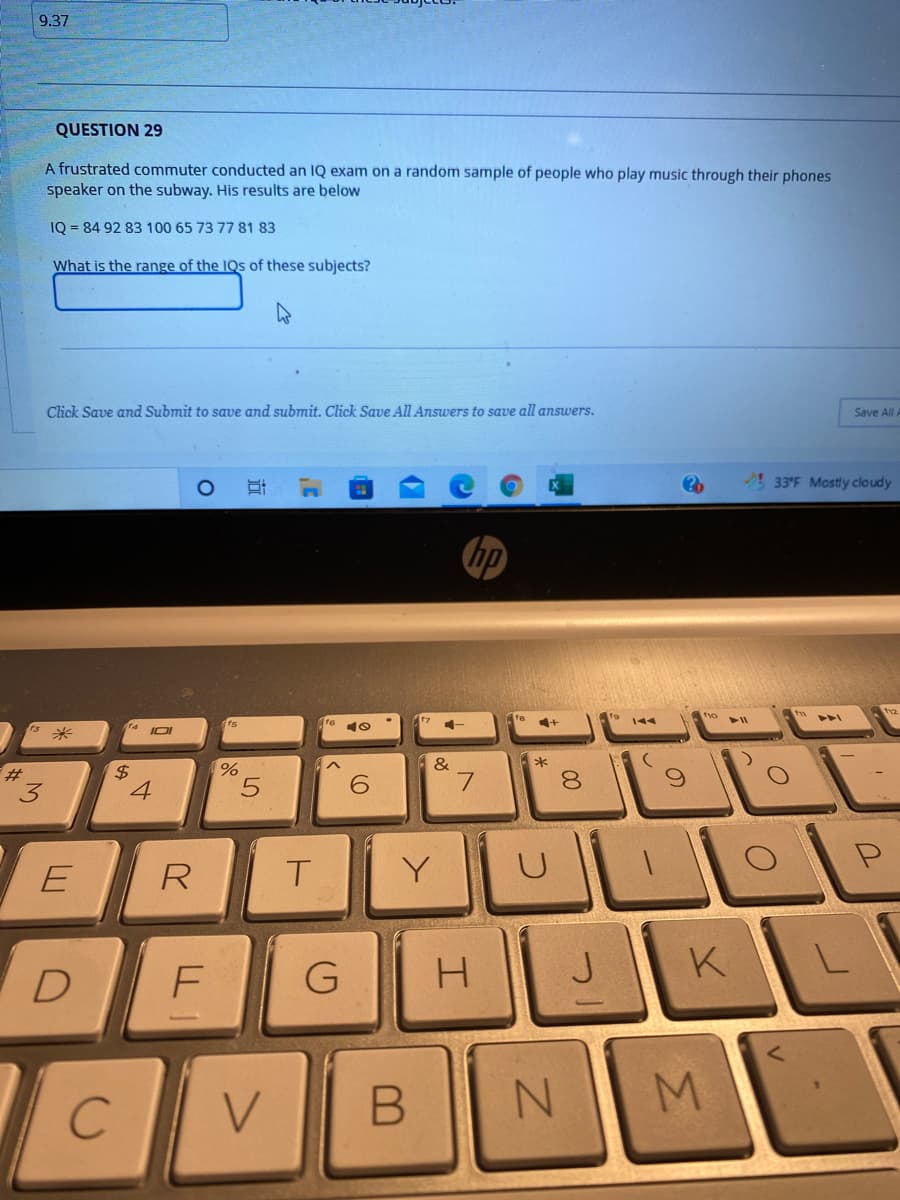
A frustrated commuter conducted an IQ exam on a random sample of people who play music through their phones speaker on the subway. His results are below IQ = 84 92 83 100 65 73 77 81 83 What is the range of the IQs of these subjects?


Q: Find the raw score which corresponds to z=1.6?
A:
Q: Suppose X ~ N (-2,3). Between what c values does 99.73% of the data lie?
A: The mean is -2 and the standard deviation is 3.
Q: a. A student performance in certain exam was 10/100, later he got a 98/100, discuss which is better…
A: Range is better than mean to reflect his performance because the mean of the two scores will not…
Q: The table below gives the number of accidents each year at a particular road intersection: 2007 4…
A:
Q: A survey item administered at the end of a training program asked participants their opinion about…
A: The given contingency table is, The formula for calculating the expected count is, Calculation of…
Q: In most research, what does the p-value have to be for results to be considered statistically…
A: Here we want to know correct option.
Q: Do students perform worse when they take an exam alone than when they take an exam in a classroom…
A:
Q: er. What will the removal of this datapoint do to the
A: Here interprete the given dot plot and derive the conclusion
Q: For numbers 6-10, use the data in the table below that summarizes results from a clinical trial of…
A: “Since you have posted a question with multiple sub-parts, we will solve first three sub-parts for…
Q: Find the number of students from the following who scored marks not more than 45. Marks range 30-40…
A: Given Information: Marks frequency 30-40 35 40-50 48 50-60 70 60-70 40 70-80 22…
Q: The cost for board exam review services costs P11500, P11750, and P11250 for years 2018, 2019, and…
A: A range is an which defines the min. & max. values for any set of nos. of a particular variable.
Q: A fitness instructor measured the heart rates of the participants in a yoga class at the summarized…
A: A histogram is a graphical representation of the distribution of numerical data. It usually…
Q: The table summarizes results from pedestrian deaths that were caused by automobile accidents.…
A: Given information: Pedestrian Intoxicated? Driver Intoxicated? Yes No Total Yes 54 79…
Q: In a national survey conducted by the Centers for Disease Control in order to determine health-risk…
A: Given data is:
Q: A researcher for the EPA measured the amount of arsenic in the water near a sewage treatment plant.…
A: Both questions are same, Frequency polygon: Generally a graph is expected to be in the form of…
Q: Help me figure out what is a p-value?
A: In this case, we need to define the p-value.
Q: In a sample of n= 6 scores, five of the scores are each above the mean by one point. Where is the…
A: The mean of a data can be obtained as follows:
Q: The table displays the scores of students on a recent exam. Find the mean of the scores to the…
A:
Q: а. Construct an FDT for the data using five class intervals b. What the table tells you, what can…
A:
Q: The table displays the scores of students on a recent exam. Find the mean of the scores to the…
A:
Q: On the right are the number of customers served by a restaurant on 40 consecutive Saturdays. (the…
A: The formula for finding the percentile p of the data is given ; k =n×p/100 where, n- is the size of…
Q: Here are data on the resting pulse rates (in beats per minute) of 19 middle school students: 71 104…
A: We know that , range is difference between highest value and lowest value hence, Range =highest…
Q: What percentage of candidates will likely score below ftable is given as State of Nature Decision S1…
A: *answer:
Q: The data set below represents the ages of 36 Executives. Find the percentile that corresponds to an…
A: Given : n=36
Q: ccording to this data, what is the "normal range" for creatinine levels? That is, in what range will…
A:
Q: A student scored between 81% and 93% on all exams except for one that she failed with a 47% because…
A: Mean & Median : The mean of the data set is calculated by adding all observations in the data…
Q: An immunologist is interested in whether the number of symptoms of the flu a person first exhibits…
A: The test is to check whether the number of symptoms of the flu a person first exhibits is related to…
Q: A student at Tolland High School wondered if boys or girls at her school traveled a greater distance…
A: Given: Sample size for girls = 50 Sample size for boys = 50 The concern is to check the average…
Q: what is the difference between frequency and relative frequency?
A: To know the difference between frequency and relative frequency, we first need to know about…
Q: The estimated score will be between
A: Here given regression equation of hours of studies and test score
Q: Do students perform worse when they take an exam alone than when they take an exam in a classroom…
A: There are two independent samples which are Alone and Classroom. Both samples come from population…
Q: The value of a certain car when it was brand new with 0 mileage was $17,000 but the value dropped to…
A: The given scatter plot is a linear and it's slope is negative. Given that, at zero miles the value…
Q: The shape of the data is not important in a frequency diagram. True O False
A: We have to find whether it is true or false
Q: MJ took a sample of 50 pieces of data. She added up all of the pieces of data and then divided by…
A: The objective is to determine which measure of central tendency is used in the given scenario.…
Q: What is the highest score that anyone achieved in the data shown on the frequency distribution table…
A:
Q: The percentage of scores falling below a z-score of .65
A:
Q: You have been tracking how much you spend on gas every month for several months and found that on…
A: The interquartile range is the difference between the third quartile and the first quartile and it…
Q: The scores on the Wechsler Adult Intelligence Scale are approximately Normal, with ?=100 and ?=15 .…
A: From the provided information, The scores on the Wechsler Adult Intelligence Scale are approximately…
Q: On a reading test, Shaylen's score of 455 was higher than the scores of 4252 of the 7274 students…
A: The percentile of score x is calculated by below formula percentile of score x =Number of data value…
Q: This tells us how much the observation spread out from the mean.
A:
Q: To two decimal places, what is the mean of these scores: 10, 15, 17, 17, 2 O 14.50
A: It is an important part of statistics. It is widely used.
Q: The table displays the scores of students on a recent exam. Find the mean of the scores to the…
A: We have to find mean
Q: Which of the following could be the median of the waiting times, in minutes? O 17.25 O 15.00 O 12.25…
A: Given: The histogram below displays the frequencies of waiting times, in minutes, for 175 patients…
Q: The data set below represents the ages of 36 executives. Find the percentile that corresponds to an…
A: Given: n=36 We know that, percentile is calculated as, Pi=i×n100th observation
Q: A professor grades 50 exams and creates a relative frequency table of the exam scores. Exam score…
A: Introduction: The median is the middle-most observation in the data set. About half or 50% of all…
Q: 25 35 72 71 88 94 77 74 43 56 56 74 55 62 77 49 86 42 66 97 58 45 73 45 83 85 47
A: Given data:…
Q: The students in Ms. Yuri's class reported the number of hours they watched television last week.…
A:
Q: (d) How high a score must you have in order to be in the top quarter of the population in social…
A: (d) The high score for order to be in the top quarter of the population in social insight is,…
Q: The table below gives the amount of time students in a class studied for a test and their test…
A: Given information: The data represents the values of the independent variable X = Hours studied and…
Q: In 1945, an organization surveyed 1100 adults and asked, "Are you a total abstainer from, or do you…
A:


Trending now
This is a popular solution!

Step by step
Solved in 2 steps

- A school bus driver records the time (in minutes) it takes to commute to school for six days.Those results are: 25, 22, 17, 20, 15, and 10. Using an alpha value of ? = 0.10, test if the meantime is significantly different than 20 minutes.Question #6 Winning team data were collected for teams in different sports, with the results given in the table below. Use the TI-83/84 Plus results at a 0.05 level of significance to test the claim that home/visitor wins are independent of the sport. TI-83/84 PLUS χ2−Test χ2=0.600249217 P=0.8963753184 df=3 Basketball Baseball Hockey Football Home team wins 114 76 64 75 Visiting team wins 63 47 41 49 __________ ( A. Fail to reject, B. Reject ) the null hypothesis that home/visitor wins are independent of the sport. It appears that the home-field advantage __________ ( A. does not, B. does ) depend on the sport.A researcher predicts that scores in treatment A will be higher than scores in treatment B. If the mean for the 10 participants in treatment A is 4 points higher than the mean for the 10 participants in treatment B and the data produced t = 2.095 What decision should be made? Choose one a. With an alpha = .05 reject the null for either a one tail or two tails b. With an alpha = .05 fail to reject the null for either a one tail or two tails c. With an alpha = .05 reject the null for one tail but fail to reject with two tails d. With an alpha = .05 reject the null for two tails but fail to reject for a one tail
- How many hours of sleep do people get by listening to music? I record 10 subjects’ hours of sleep after they listen to 4 types of music: White noise, Rock, Pop, and Classical. For each music condition, they provide an average amount of hours of sleep they got for 1 week. Using the following data, test whether there is a significant difference in hours of sleep between types of music at an alpha of 0.01. Subject White noise Rock Pop Classical 1 5 5 7.5 9 2 9.5 6.5 7 9 3 7.5 6 7 10 4 8 6 7 8 5 8.5 5 6 8 6 6 5.5 7 10 7 7 6.5 9 9 8 8 5 5 9.5 9 8 6 7 8 10 8 7 7.5 7 What is the null hypothesis? _______________________ What is the alternative hypothesis? __________________ What is the critical F value? _________________How many hours of sleep do people get by listening to music? I record 10 subjects’ hours of sleep after they listen to 4 types of music: White noise, Rock, Pop, and Classical. For each music condition, they provide an average amount of hours of sleep they got for 1 week. Using the following data, test whether there is a significant difference in hours of sleep between types of music at an alpha of 0.01. Subject White noise Rock Pop Classical 1 5 5 7.5 9 2 9.5 6.5 7 9 3 7.5 6 7 10 4 8 6 7 8 5 8.5 5 6 8 6 6 5.5 7 10 7 7 6.5 9 9 8 8 5 5 9.5 9 8 6 7 8 10 8 7 7.5 7 Complete the ANOVA summary table: Source of Variation Sums of Squares df MS (Variance) F Between-groups Within-groups (error) Total What do we conclude? Using a bonferroni correction, run a post-hoc test on the type of music and…31. A psychologist noted that people have more difficulty sleeping in a bright room then in a dark room. She measured wether the intensity of the light could predict the time it took a sample of four participants to fall asleep. The data for this hypothetical study and make a decision to retain or reject the null hypothesis. Intensity of Light (in watts) Time it took to sleep (sleep in minutes) X Y 5 10 10 18 20 30 40 35
- An article includes the accompanying data on compression strength (lb) for a sample of 12-oz aluminum cans filled with strawberry drink and another sample filled with cola. Beverage Sample Size Sample Mean Sample SD Strawberry Drink 10 535 24 Cola 10 559 15 Does the data suggest that the extra carbonation of cola results in a higher average compression strength? Base your answer on a P-value. (Use ? = 0.05.) State the relevant hypotheses. (Use ?1 for the strawberry drink and ?2 for the cola.) H0: ?1 − ?2 = 0Ha: ?1 − ?2 ≥ 0H0: ?1 − ?2 = 0Ha: ?1 − ?2 ≠ 0 H0: ?1 − ?2 = 0Ha: ?1 − ?2 < 0H0: ?1 − ?2 = 0Ha: ?1 − ?2 > 0 Calculate the test statistic and determine the P-value. (Round your test statistic to one decimal place and your P-value to three decimal places.) t = P-value = State the conclusion in the problem context. Reject H0. The data suggests that cola has a higher average compression strength than the strawberry drink.Reject H0. The…3. (Inspired by 4.10 in Bodine et al.) The basal metabolic rate (kcal/day) of large anteaters is believed to be subject to a power law relationship with its weight (kg). A study was performed measuring several anteaters and reported the following data: Weight (kg) 6.0 28.5 16.0 19.0 23.5 11.0 9.0 25.5 22.0 BMR (kcal/day) 80.1 247.0 162.3 172.4 215.1 111.9 104.6 224.6 208.3 Transform the data correctly to perform a linear least-squares regression, then report your model as y=cxp. Estimate the BMR for a 27 kg anteater.. Suppose we wish to assess whether there is a relationship between exercise on campus and students' living arrangements. The data are shown below. No Regular Exercise Sporadic Exercise Regular Exercise Dormitory 32 30 28 On-Campus Apartment 74 64 42 Off-Campus Apartment 110 25 15 At Home 39 6 5 Based on the data, use the chi square test to determine the relationship between exercise and student's living arrangement? Do you think where a person lives affect their exercise status? Let = 0.05.
- In reporting the results of a statistical analysis, a researcher reports that "p = .33". This implies that ________. a. the alternative hypothesis was accepted with an alpha level of .05 b. the alternative hypothesis was not accepted with an alpha level of .05 c. the null hypothesis was not rejected with an alpha level of .05 d. the null hypothesis was rejected with an alpha level of .05Marine biologists have noticed that the color of the outermost growth band on a clam tends to be related to the time of year in which the clam dies. A biologist conducted a small investigation of whether this is true for the species Protothaca staminea. She collected a sample of 50 clam shells in February and 27 clam shells in March. 15 of the shells from February had a dark color on the outermost growth band, whereas 8 of the shells from March had a dark color on the outermost growth band. Carry out a hypothesis test to see if there is a difference in the proportion of shells with a dark outermost growth band between the two months. The point estimate for the true difference in proportion of dark growth bands between February and March is:Marine biologists have noticed that the color of the outermost growth band on a clam tends to be related to the time of year in which the clam dies. A biologist conducted a small investigation of whether this is true for the species Protothaca staminea. She collected a sample of 50 clam shells in February and 27 clam shells in March. 15 of the shells from February had a dark color on the outermost growth band, whereas 8 of the shells from March had a dark color on the outermost growth band. Carry out a hypothesis test to see if there is a difference in the proportion of shells with a dark outermost growth band between the two months. Let ? = 0.01. A) The point estimate for the true difference in proportion of dark growth bands between February and March is:
