d) It is suspected that vehicle buyers associate the vehicle manufacturer and the size of auto they buy. The following data is collected on 1000 vehicle buyers to test if there is any association in their preferences. - At alpha = 0.05, test the hypothesis of association between vehicle manufacture and size of car in the mind of vehicle buyers. Is there an association at alpha = 0.01, i.e 1% level of significance Hint (Use habd calculation and R codes to support your findings) Vehicle Manufacturer B c D 157 65 Autosize A Total Small 181 10 413 Medium 126 82 142 46 396 28 191 341 192 | 383 84 1000 Large 58 45 60 Total
d) It is suspected that vehicle buyers associate the vehicle manufacturer and the size of auto they buy. The following data is collected on 1000 vehicle buyers to test if there is any association in their preferences. - At alpha = 0.05, test the hypothesis of association between vehicle manufacture and size of car in the mind of vehicle buyers. Is there an association at alpha = 0.01, i.e 1% level of significance Hint (Use habd calculation and R codes to support your findings) Vehicle Manufacturer B c D 157 65 Autosize A Total Small 181 10 413 Medium 126 82 142 46 396 28 191 341 192 | 383 84 1000 Large 58 45 60 Total

Glencoe Algebra 1, Student Edition, 9780079039897, 0079039898, 2018
18th Edition
ISBN:9780079039897
Author:Carter
Publisher:Carter
Chapter10: Statistics
Section: Chapter Questions
Problem 13PT

Related questions
Question
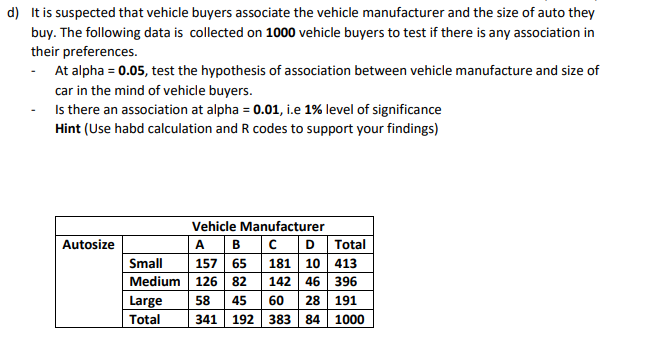
Transcribed Image Text:d) It is suspected that vehicle buyers associate the vehicle manufacturer and the size of auto they
buy. The following data is collected on 1000 vehicle buyers to test if there is any association in
their preferences.
- At alpha = 0.05, test the hypothesis of association between vehicle manufacture and size of
car in the mind of vehicle buyers.
- Is there an association at alpha = 0.01, i.e 1% level of significance
Hint (Use habd calculation and R codes to support your findings)
Vehicle Manufacturer
Autosize
A
В
c D Total
Small
157 65
181 10 413
Medium 126
82
142 46 396
28 191
192 383 84
Large
58
45
60
Total
341
1000
Expert Solution
This question has been solved!
Explore an expertly crafted, step-by-step solution for a thorough understanding of key concepts.

Step by step
Solved in 2 steps with 2 images

Recommended textbooks for you
Glencoe Algebra 1, Student Edition, 9780079039897…
Algebra
ISBN:
9780079039897
Author:
Carter
Publisher:
McGraw Hill
Glencoe Algebra 1, Student Edition, 9780079039897…
Algebra
ISBN:
9780079039897
Author:
Carter
Publisher:
McGraw Hill