A graduate student is interested in how viewing different types of scenes affects working memory. For his study, he selects a random sample of 36 adults. The subjects complete a series of working memory tests before and after walking in an urban setting. Before the walk, the mean score on the test of working memory was 9.1. After the walk, the mean score was 1.4 higher. The graduate student has no presupposed assumptions about how viewing different types of scenes affects working memory, so he formulates the null and alternative hypotheses as: Họ : Pp-0 H : PD - 0 Assume that the data satisfy all of the required assumptions for a repeated-measures t test. The graduate student calculates the following statistics for his hypothesis test: Mean difference (Mp) 1.4 Estimated population standard deviation of the differences (s) 1.6 Estimated standard error of the mean differences (SMD) 0.2667 Degrees of freedom (df) 35 The t statistic 5.25 The critical values of t whena.05 2.030 Notice that since the t statistic (5.25) is in the critical region (t < -2.030 or:> 2.030), the hypothesis test is significant when a-.05. A 95% confidence interval for the mean difference is Use Cohen's d to calculate the effect size. The absolute value of the estimated d is . Using Cohen's criteria, this is a v effect size. Use r to calculate the effect size. The r is . This value of r means that, on average, % of the variability in the working memory is explained by whether it was measured before or after the walk. (Round to the nearest percent.)
A graduate student is interested in how viewing different types of scenes affects working memory. For his study, he selects a random sample of 36 adults. The subjects complete a series of working memory tests before and after walking in an urban setting. Before the walk, the mean score on the test of working memory was 9.1. After the walk, the mean score was 1.4 higher. The graduate student has no presupposed assumptions about how viewing different types of scenes affects working memory, so he formulates the null and alternative hypotheses as: Họ : Pp-0 H : PD - 0 Assume that the data satisfy all of the required assumptions for a repeated-measures t test. The graduate student calculates the following statistics for his hypothesis test: Mean difference (Mp) 1.4 Estimated population standard deviation of the differences (s) 1.6 Estimated standard error of the mean differences (SMD) 0.2667 Degrees of freedom (df) 35 The t statistic 5.25 The critical values of t whena.05 2.030 Notice that since the t statistic (5.25) is in the critical region (t < -2.030 or:> 2.030), the hypothesis test is significant when a-.05. A 95% confidence interval for the mean difference is Use Cohen's d to calculate the effect size. The absolute value of the estimated d is . Using Cohen's criteria, this is a v effect size. Use r to calculate the effect size. The r is . This value of r means that, on average, % of the variability in the working memory is explained by whether it was measured before or after the walk. (Round to the nearest percent.)

Linear Algebra: A Modern Introduction
4th Edition
ISBN:9781285463247
Author:David Poole
Publisher:David Poole
Chapter2: Systems Of Linear Equations
Section2.4: Applications
Problem 28EQ

Related questions
Question
answer all questions
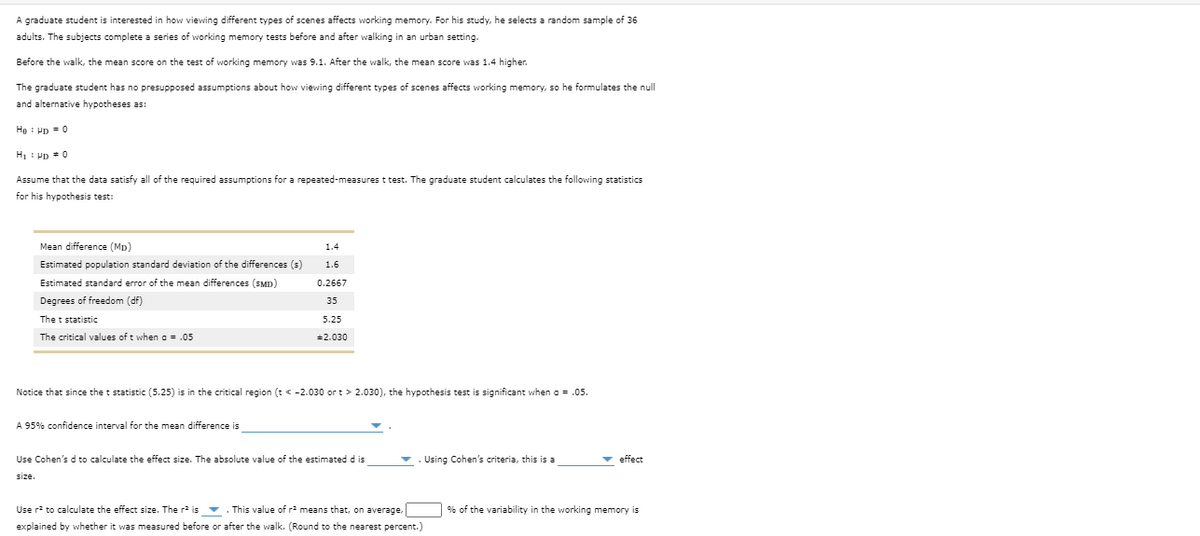
Transcribed Image Text:A graduate student is interested in how viewing different types of scenes affects working memory. For his study, he selects a random sample of 36
adults. The subjects complete a series of working memory tests before and after walking in an urban setting.
Before the walk, the mean score on the test of working memory was 9.1. After the walk, the mean score was 1.4 higher.
The graduate student has no presupposed assumptions about how viewing different types of scenes affects working memory, so he formulates the null
and alternative hypotheses as:
Ho : Pp - 0
H : Pp * 0
Assume that the data satisfy all of the required assumptions for a repeated-measures t test. The graduate student calculates the following statistics
for his hypothesis test:
Mean difference (Mp)
1.4
Estimated population standard deviation of the differences (s)
1.6
Estimated standard error of the mean differences (SMD)
0.2667
Degrees of freedom (df)
35
The t statistic
5.25
The critical values of t when a = .05
=2.030
Notice that since the t statistic (5.25) is in the critical region (t < -2.030 or t> 2.030), the hypothesis test is significant when a = .05.
A 95% confidence interval for the mean difference is
Use Cohen's d to calculate the effect size. The absolute value of the estimated d is
Using Cohen's criteria, this is a
v effect
size.
Use r to calculate the effect size. The r is v . This value of r means that, on average,
9% of the variability in the working memory is
explained by whether it was measured before or after the walk. (Round to the nearest percent.)
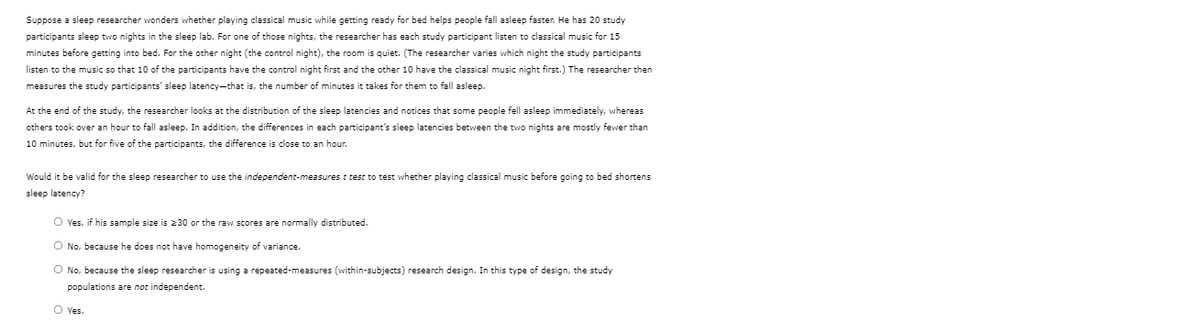
Transcribed Image Text:Suppose a sleep researcher wonders whether playing classical music while getting ready for bed helps people fall asleep faster. He has 20 study
participants sleep two nights in the sleep lab. For one of those nights, the researcher has each study participant listen to classical music for 15
minutes before getting into bed. For the other night (the control night), the room is quiet. (The researcher varies which night the study participants
listen to the music so that 10 of the participants have the control night first and the other 10 have the classical music night first.) The researcher then
measures the study participants' sleep latency-that is, the number of minutes it takes for them to fall asleep.
At the end of the study, the researcher looks at the distribution of the sleep latencies and notices that some people fell asleep immediately, whereas
others took over an hour to fall asleep. In addition, the differences in each participant's sleep latencies between the two nights are mostly fewer than
10 minutes, but for five of the participants, the difference is close to an hour.
Would it be valid for the sleep researcher to use the independent-measures t test to test whether playing classical music before going to bed shortens
sleep latency?
O Yes, if his sample size is 230 or the raw scores are normally distributed.
O No, because he does not have homogeneity of variance.
O No, because the sleep researcher is using a repeated-measures (within-subjects) research design. In this type of design, the study
populations are not independent.
O Yes.
Expert Solution
This question has been solved!
Explore an expertly crafted, step-by-step solution for a thorough understanding of key concepts.

This is a popular solution!

Trending now
This is a popular solution!

Step by step
Solved in 2 steps with 2 images

Recommended textbooks for you
Linear Algebra: A Modern Introduction
Algebra
ISBN:
9781285463247
Author:
David Poole
Publisher:
Cengage Learning

Algebra for College Students
Algebra
ISBN:
9781285195780
Author:
Jerome E. Kaufmann, Karen L. Schwitters
Publisher:
Cengage Learning

College Algebra (MindTap Course List)
Algebra
ISBN:
9781305652231
Author:
R. David Gustafson, Jeff Hughes
Publisher:
Cengage Learning
Linear Algebra: A Modern Introduction
Algebra
ISBN:
9781285463247
Author:
David Poole
Publisher:
Cengage Learning
Algebra for College Students
Algebra
ISBN:
9781285195780
Author:
Jerome E. Kaufmann, Karen L. Schwitters
Publisher:
Cengage Learning
College Algebra (MindTap Course List)
Algebra
ISBN:
9781305652231
Author:
R. David Gustafson, Jeff Hughes
Publisher:
Cengage Learning

Trigonometry (MindTap Course List)
Trigonometry
ISBN:
9781337278461
Author:
Ron Larson
Publisher:
Cengage Learning
