For Tukey’s HSD, how would you report your results? (groups: 1= 5-25 years, 2 = 26-59 years, 3 = 60-92 years) Group of answer choices: 1. A Tukey’s post hoc test (p < .05) revealed that the mean FIQ score for younger subjects (112.40) was significantly different than the mean FIQ scores for middle-age subjects (107.15) and older subjects (108.40). 2. A Tukey’s post hoc test (p < .05) revealed that the mean FIQ score for younger subjects (112.40) was significantly higher than the mean FIQ scores for middle-age subjects (107.15) and older subjects (108.40). 3. A Tukey’s post hoc test (p < .05) revealed that the mean FIQ score for younger subjects (109.08) was significantly lower than the mean FIQ score for middle-age subjects (112.40) but significantly higher than the mean FIQ score for older subjects (107.15). 4. A Tukey’s post hoc test (p < .05) revealed that the mean FIQ scores for younger subjects (108.40) and older subjects (109.08) were not different, but both were significantly higher than the mean FIQ score for middle-age subjects (107.15). 5. A Tukey’s post hoc test (p < .05) revealed that the mean FIQ scores for younger subjects (107.15) and middle-age subjects (108.40) were not different from one another, but both were significantly lower than the mean FIQ score for older subjects (112.40). 6. None of the above
For Tukey’s HSD, how would you report your results? (groups: 1= 5-25 years, 2 = 26-59 years, 3 = 60-92 years) Group of answer choices: 1. A Tukey’s post hoc test (p < .05) revealed that the mean FIQ score for younger subjects (112.40) was significantly different than the mean FIQ scores for middle-age subjects (107.15) and older subjects (108.40). 2. A Tukey’s post hoc test (p < .05) revealed that the mean FIQ score for younger subjects (112.40) was significantly higher than the mean FIQ scores for middle-age subjects (107.15) and older subjects (108.40). 3. A Tukey’s post hoc test (p < .05) revealed that the mean FIQ score for younger subjects (109.08) was significantly lower than the mean FIQ score for middle-age subjects (112.40) but significantly higher than the mean FIQ score for older subjects (107.15). 4. A Tukey’s post hoc test (p < .05) revealed that the mean FIQ scores for younger subjects (108.40) and older subjects (109.08) were not different, but both were significantly higher than the mean FIQ score for middle-age subjects (107.15). 5. A Tukey’s post hoc test (p < .05) revealed that the mean FIQ scores for younger subjects (107.15) and middle-age subjects (108.40) were not different from one another, but both were significantly lower than the mean FIQ score for older subjects (112.40). 6. None of the above

MATLAB: An Introduction with Applications
6th Edition
ISBN:9781119256830
Author:Amos Gilat
Publisher:Amos Gilat
Chapter1: Starting With Matlab
Section: Chapter Questions
Problem 1P

Related questions
Question
For Tukey’s HSD, how would you report your results? (groups: 1= 5-25 years, 2 = 26-59 years, 3 = 60-92 years)
Group of answer choices:
1. A Tukey’s post hoc test (p < .05) revealed that the mean FIQ score for younger subjects (112.40) was significantly different than the mean FIQ scores for middle-age subjects (107.15) and older subjects (108.40).
2. A Tukey’s post hoc test (p < .05) revealed that the mean FIQ score for younger subjects (112.40) was significantly higher than the mean FIQ scores for middle-age subjects (107.15) and older subjects (108.40).
3. A Tukey’s post hoc test (p < .05) revealed that the mean FIQ score for younger subjects (109.08) was significantly lower than the mean FIQ score for middle-age subjects (112.40) but significantly higher than the mean FIQ score for older subjects (107.15).
4. A Tukey’s post hoc test (p < .05) revealed that the mean FIQ scores for younger subjects (108.40) and older subjects (109.08) were not different, but both were significantly higher than the mean FIQ score for middle-age subjects (107.15).
5. A Tukey’s post hoc test (p < .05) revealed that the mean FIQ scores for younger subjects (107.15) and middle-age subjects (108.40) were not different from one another, but both were significantly lower than the mean FIQ score for older subjects (112.40).
6. None of the above
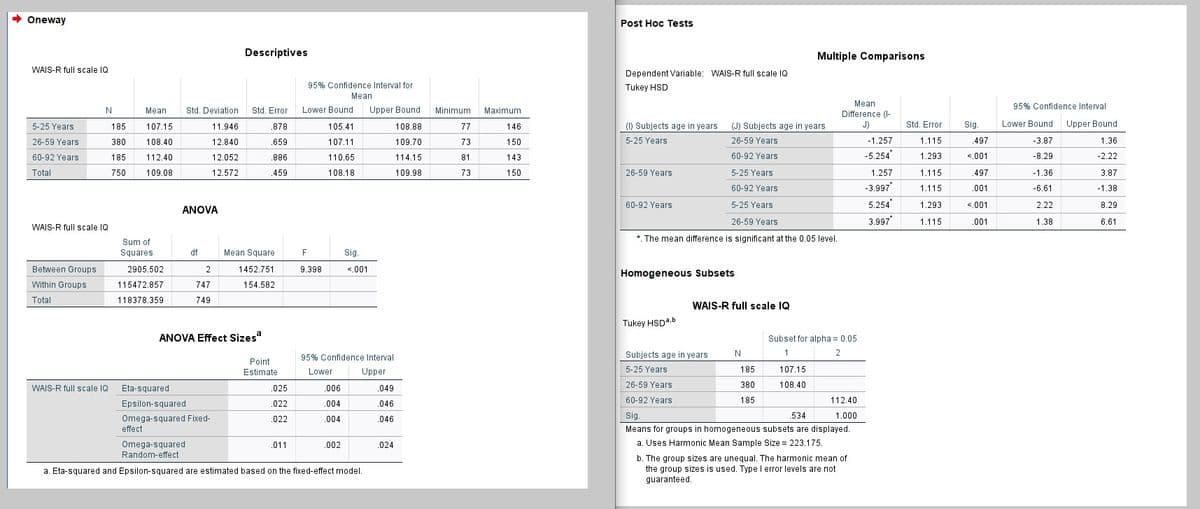
Transcribed Image Text:Oneway
Post Hoc Tests
Descriptives
Multiple Comparisons
WAIS-R full scale IQ
Dependent Variable: WAIS-R full scale IQ
95% Confidence Interval for
Tukey HSD
Mean
Mean
Difference (I-
J)
95% Confidence Interval
Mean
Std. Deviation
Std. Error
Lower Bound
Upper Bound
Minimum
Maximum
5-25 Years
185
107.15
11.946
.878
105.41
108.88
77
146
(1) Subjects age in years
(J) Subiects age in years
Std. Error
Sig.
Lower Bound
Upper Bound
26-59 Years
380
108.40
12.840
.659
107.11
109.70
73
150
5-25 Years
26-59 Years
-1.257
1.115
.497
-3.87
1.36
60-92 Years
185
112.40
12.052
.886
110.65
114.15
81
143
60-92 Years
-5.254
1.293
<.001
-8.29
-2.22
Total
750
109.08
12.572
.459
108.18
109.98
73
150
26-59 Years
5-25 Years
1.257
1.115
.497
-1.36
3.87
60-92 Years
-3.997"
1.115
.001
-6.61
-1.38
60-92 Years
5-25 Years
5.254
1.293
<.001
2.22
8.29
ANOVA
26-59 Years
3.997
1.115
.001
1.38
6.61
WAIS-R full scale IQ
*. The mean difference is significant at the 0.05 level.
Sum of
Squares
df
Mean Square
F
Sig.
Between Groups
2905.502
2
1452.751
9.398
<.001
Homogeneous Subsets
Within Groups
115472.857
747
154.582
Total
118378.359
749
WAIS-R full scale IQ
Tukey HSDa.b
ANOVA Effect Sizes
Subset for alpha = 0.05
Subjects age in years
N
1
2
95% Confidence Interval
Point
Estimate
Lower
Upper
5-25 Years
185
107.15
WAIS-R full scale IQ Eta-squared
108.40
26-59 Years
380
.025
.006
.049
60-92 Years
185
112.40
Epsilon-squared
.022
.004
.046
Omega-squared Fixed-
.022
.004
.046
Sig.
.534
1.000
effect
Means for groups in homogeneous subsets are displayed.
a. Uses Harmonic Mean Sample Size = 223.175.
Omega-squared
Random-effect
.011
.002
.024
b. The group sizes are unequal. The harmonic mean of
the group sizes is used. Type I error levels are not
guaranteed.
a. Eta-squared and Epsilon-squared are estimated based on the fixed-effect model.
Expert Solution
This question has been solved!
Explore an expertly crafted, step-by-step solution for a thorough understanding of key concepts.

Step by step
Solved in 2 steps

Recommended textbooks for you
MATLAB: An Introduction with Applications
Statistics
ISBN:
9781119256830
Author:
Amos Gilat
Publisher:
John Wiley & Sons Inc

Probability and Statistics for Engineering and th…
Statistics
ISBN:
9781305251809
Author:
Jay L. Devore
Publisher:
Cengage Learning

Statistics for The Behavioral Sciences (MindTap C…
Statistics
ISBN:
9781305504912
Author:
Frederick J Gravetter, Larry B. Wallnau
Publisher:
Cengage Learning
MATLAB: An Introduction with Applications
Statistics
ISBN:
9781119256830
Author:
Amos Gilat
Publisher:
John Wiley & Sons Inc
Probability and Statistics for Engineering and th…
Statistics
ISBN:
9781305251809
Author:
Jay L. Devore
Publisher:
Cengage Learning
Statistics for The Behavioral Sciences (MindTap C…
Statistics
ISBN:
9781305504912
Author:
Frederick J Gravetter, Larry B. Wallnau
Publisher:
Cengage Learning

Elementary Statistics: Picturing the World (7th E…
Statistics
ISBN:
9780134683416
Author:
Ron Larson, Betsy Farber
Publisher:
PEARSON

The Basic Practice of Statistics
Statistics
ISBN:
9781319042578
Author:
David S. Moore, William I. Notz, Michael A. Fligner
Publisher:
W. H. Freeman

Introduction to the Practice of Statistics
Statistics
ISBN:
9781319013387
Author:
David S. Moore, George P. McCabe, Bruce A. Craig
Publisher:
W. H. Freeman