A graph of a model for the sales of services between 2004 and 2008 by a leading global provider of staffing services is shown below. million dollars (7, 4982) 5000- (6, 4891) (8, 4891) 4800 4600 (5, 4617) 4400 4200 (4, 4160) years since 2000 (a) Use the graph to calculate the average rate of change in sales of services between 2004 and 2007. million per year Interpret the result. Between 2004 and 2007, sales of service ---Select--- by an average of $ million per year. (b) Calculate the percentage change in sales between 2007 and 2008. (Round your answer to three decimal places.) Interpret the result. Between 2007 and 2008, sales of service ---Select--- by %. (c) Calculate the change in sales between 2004 and 2008. million
A graph of a model for the sales of services between 2004 and 2008 by a leading global provider of staffing services is shown below. million dollars (7, 4982) 5000- (6, 4891) (8, 4891) 4800 4600 (5, 4617) 4400 4200 (4, 4160) years since 2000 (a) Use the graph to calculate the average rate of change in sales of services between 2004 and 2007. million per year Interpret the result. Between 2004 and 2007, sales of service ---Select--- by an average of $ million per year. (b) Calculate the percentage change in sales between 2007 and 2008. (Round your answer to three decimal places.) Interpret the result. Between 2007 and 2008, sales of service ---Select--- by %. (c) Calculate the change in sales between 2004 and 2008. million

College Algebra
7th Edition
ISBN:9781305115545
Author:James Stewart, Lothar Redlin, Saleem Watson
Publisher:James Stewart, Lothar Redlin, Saleem Watson
Chapter2: Functions
Section2.4: Average Rate Of Change Of A Function
Problem 33E: DVD Player sales The table shows the number of DVD play-ers sold in a small electronics store in the...

Related questions
Question
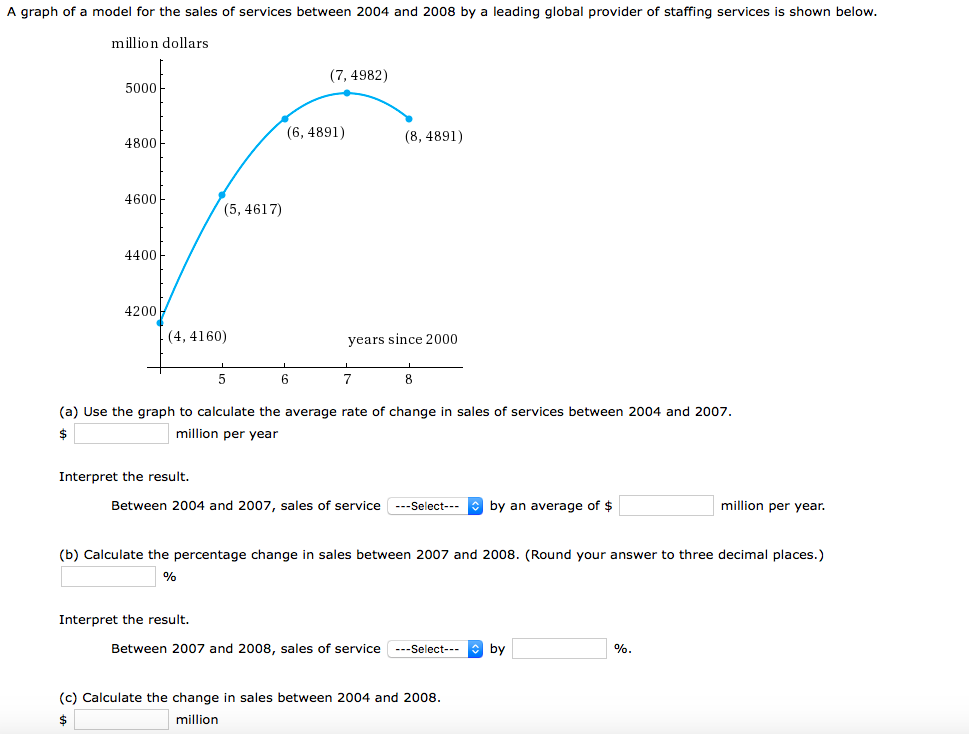
Transcribed Image Text:A graph of a model for the sales of services between 2004 and 2008 by a leading global provider of staffing services is shown below.
million dollars
(7, 4982)
5000-
(6, 4891)
(8, 4891)
4800
4600
(5, 4617)
4400
4200
(4, 4160)
years since 2000
(a) Use the graph to calculate the average rate of change in sales of services between 2004 and 2007.
million per year
Interpret the result.
Between 2004 and 2007, sales of service ---Select---
by an average of $
million per year.
(b) Calculate the percentage change in sales between 2007 and 2008. (Round your answer to three decimal places.)
Interpret the result.
Between 2007 and 2008, sales of service
---Select--- by
%.
(c) Calculate the change in sales between 2004 and 2008.
million
Expert Solution
This question has been solved!
Explore an expertly crafted, step-by-step solution for a thorough understanding of key concepts.

This is a popular solution!

Trending now
This is a popular solution!

Step by step
Solved in 3 steps with 3 images

Recommended textbooks for you
College Algebra
Algebra
ISBN:
9781305115545
Author:
James Stewart, Lothar Redlin, Saleem Watson
Publisher:
Cengage Learning


College Algebra
Algebra
ISBN:
9781305115545
Author:
James Stewart, Lothar Redlin, Saleem Watson
Publisher:
Cengage Learning

Trigonometry (MindTap Course List)
Trigonometry
ISBN:
9781337278461
Author:
Ron Larson
Publisher:
Cengage Learning

Algebra & Trigonometry with Analytic Geometry
Algebra
ISBN:
9781133382119
Author:
Swokowski
Publisher:
Cengage

College Algebra (MindTap Course List)
Algebra
ISBN:
9781305652231
Author:
R. David Gustafson, Jeff Hughes
Publisher:
Cengage Learning