A greenhouse full of tomato plants is being looked after by a farmer. He measures each of the plants to see how well they are growing. Based on his measurements, the following frequency table has been produced Height H(mm) Frequency 120 SH< 130 10 130 SH< 140 20 140 SH< 150 25 150 SH< 160 160 SH< 170 15 ON A SEPARATE SHEET OF PAPER CREATE A FREQUENCY HISTOGRAM TO REPRESENT THE DATA. EMBED THE ANSWER HERE.
A greenhouse full of tomato plants is being looked after by a farmer. He measures each of the plants to see how well they are growing. Based on his measurements, the following frequency table has been produced Height H(mm) Frequency 120 SH< 130 10 130 SH< 140 20 140 SH< 150 25 150 SH< 160 160 SH< 170 15 ON A SEPARATE SHEET OF PAPER CREATE A FREQUENCY HISTOGRAM TO REPRESENT THE DATA. EMBED THE ANSWER HERE.

Mathematics For Machine Technology
8th Edition
ISBN:9781337798310
Author:Peterson, John.
Publisher:Peterson, John.
Chapter48: Applications Of Formulas To Spur Gears
Section: Chapter Questions
Problem 23A

Related questions
Question
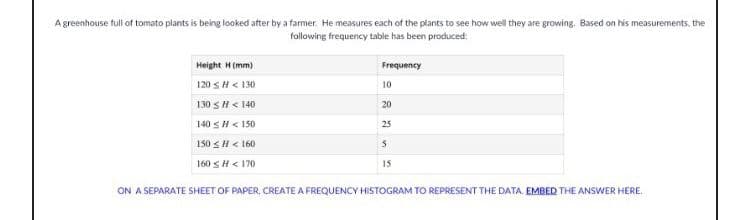
Transcribed Image Text:A greenhouse full of tomato plants is being looked after by a farmer. He measures each of the plants to see how well they are growing. Based on his measurements, the
following frequency table has been produced:
Height H(mm)
Frequency
120 SH< 130
10
130 SH< 140
20
140 SH< 150
25
150 SH < 160
160 SH< 170
15
ON A SEPARATE SHEET OF PAPER, CREATE A FREQUENCY HISTOGRAM TO REPRESENT THE DATA. EMBED THE ANSWER HERE.
Expert Solution
This question has been solved!
Explore an expertly crafted, step-by-step solution for a thorough understanding of key concepts.

This is a popular solution!

Trending now
This is a popular solution!

Step by step
Solved in 2 steps with 1 images

Knowledge Booster


Learn more about
Need a deep-dive on the concept behind this application? Look no further. Learn more about this topic, statistics and related others by exploring similar questions and additional content below.Recommended textbooks for you
Mathematics For Machine Technology
Advanced Math
ISBN:
9781337798310
Author:
Peterson, John.
Publisher:
Cengage Learning,

Glencoe Algebra 1, Student Edition, 9780079039897…
Algebra
ISBN:
9780079039897
Author:
Carter
Publisher:
McGraw Hill
Mathematics For Machine Technology
Advanced Math
ISBN:
9781337798310
Author:
Peterson, John.
Publisher:
Cengage Learning,
Glencoe Algebra 1, Student Edition, 9780079039897…
Algebra
ISBN:
9780079039897
Author:
Carter
Publisher:
McGraw Hill