A group of fish specialists are trying to gain information about the population of trout in a particular lake. They catch and release 16 fish on a single day and record their lengths in centimeters 41 46 32 37 56 28 31 34 53 42 39 41 43 48 27 45 a. Make a histogram of these data using a bin width of 5. Be sure to label your axes and include scales. b. Report the mean, standard deviation, five-number summary and interquartile range of these data. (Note: You can use technology to find these values! Take a look at the Supplemental Readings in the "Readings, Videos.. for Week 2" page for some help with the technology.)
A group of fish specialists are trying to gain information about the population of trout in a particular lake. They catch and release 16 fish on a single day and record their lengths in centimeters 41 46 32 37 56 28 31 34 53 42 39 41 43 48 27 45 a. Make a histogram of these data using a bin width of 5. Be sure to label your axes and include scales. b. Report the mean, standard deviation, five-number summary and interquartile range of these data. (Note: You can use technology to find these values! Take a look at the Supplemental Readings in the "Readings, Videos.. for Week 2" page for some help with the technology.)

Glencoe Algebra 1, Student Edition, 9780079039897, 0079039898, 2018
18th Edition
ISBN:9780079039897
Author:Carter
Publisher:Carter
Chapter10: Statistics
Section: Chapter Questions
Problem 22SGR

Related questions

Question
Transcribed Image Text:A group of fish specialists are trying to gain information about the population of trout in
a particular lake. They catch and release 16 fish on a single day and record their lengths
in centimeters
41 46 32 37 56 28 31 34
53 42 39 41 43 48 27 45
a. Make a histogram of these data using a bin width of 5. Be sure to label your axes
and include scales.
b. Report the mean, standard deviation, five-number summary and interquartile
range of these data. (Note: You can use technology to find these values! Take a
look at the Supplemental Readings in the "Readings, Videos.. for Week 2" page
for some help with the technology.)
Expert Solution
a. Histogram:
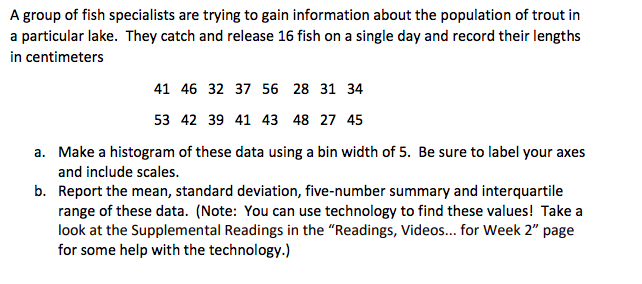
Step-by-step procedure to obtain class interval table using Excel:
- Select the data and go to Insert > PivotTable.
- In Table/Range, select the data.
- Click OK.
- In PivotTable Fields, move score to rows.
- Select a score from Row Labels.
- Select
- In Starting at, enter
- In Ending at, enter
- In By, enter
The output is given as follows:
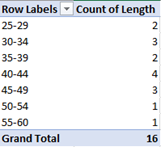
The histogram for the above table is drawn as shown below:

Step by step
Solved in 2 steps with 3 images

Knowledge Booster


Learn more about
Need a deep-dive on the concept behind this application? Look no further. Learn more about this topic, statistics and related others by exploring similar questions and additional content below.Recommended textbooks for you
Glencoe Algebra 1, Student Edition, 9780079039897…
Algebra
ISBN:
9780079039897
Author:
Carter
Publisher:
McGraw Hill
Glencoe Algebra 1, Student Edition, 9780079039897…
Algebra
ISBN:
9780079039897
Author:
Carter
Publisher:
McGraw Hill