A group of third grade students is taught using a new curriculum. A control group of third grade students is taught using the old curriculum. The reading test scores for the two groups are shown in 97665310 589 the back-to-back stem-and-leaf plot. At a0.10, is 877541106012233778899 there enough evidence to support the claim that the new method of teaching reading produces higher reading test scores than the old method does? Assume the population variances are equal. Complete parts (a) through (e) below. Assume the samples are random and independent, and the populations are normally distributed. Old Curriculum New Curriculum 93 97 40 01356799 Key: 417|0 = 74 Old and 70 New (a) Identify the claim and state Hg and Hg. Which is the correct claim below? OA. "The new method of teaching reading produces higher reading test scores than the old method." OB. "The new method of teaching reading produces equal reading test scores as the old method. OC. "The new method of teaching reading produces lower reading test scores than the old method." OD. "The new method of teaching reading produces different reading test scores than the old method." What are Hg and H,? Assume that u, represents the mean of the test scores of those taught with the old curiculum and uz represents the mean from the new curriculum. Identify the claim. The null hypothesis, Ho. is The alternative hypothesis, Ha. is Which hypothesis is the claim? O The altemative hypothesis, Ha O The null hypothesis, Ho Decide whether to reject or fail to reject the null hypothesis. the null hypothesis. (e) Interpret the decision in the context of the original claim. At the 10% significance level, enough evidence to support the claim.
A group of third grade students is taught using a new curriculum. A control group of third grade students is taught using the old curriculum. The reading test scores for the two groups are shown in 97665310 589 the back-to-back stem-and-leaf plot. At a0.10, is 877541106012233778899 there enough evidence to support the claim that the new method of teaching reading produces higher reading test scores than the old method does? Assume the population variances are equal. Complete parts (a) through (e) below. Assume the samples are random and independent, and the populations are normally distributed. Old Curriculum New Curriculum 93 97 40 01356799 Key: 417|0 = 74 Old and 70 New (a) Identify the claim and state Hg and Hg. Which is the correct claim below? OA. "The new method of teaching reading produces higher reading test scores than the old method." OB. "The new method of teaching reading produces equal reading test scores as the old method. OC. "The new method of teaching reading produces lower reading test scores than the old method." OD. "The new method of teaching reading produces different reading test scores than the old method." What are Hg and H,? Assume that u, represents the mean of the test scores of those taught with the old curiculum and uz represents the mean from the new curriculum. Identify the claim. The null hypothesis, Ho. is The alternative hypothesis, Ha. is Which hypothesis is the claim? O The altemative hypothesis, Ha O The null hypothesis, Ho Decide whether to reject or fail to reject the null hypothesis. the null hypothesis. (e) Interpret the decision in the context of the original claim. At the 10% significance level, enough evidence to support the claim.

MATLAB: An Introduction with Applications
6th Edition
ISBN:9781119256830
Author:Amos Gilat
Publisher:Amos Gilat
Chapter1: Starting With Matlab
Section: Chapter Questions
Problem 1P

Related questions

Topic Video
Question
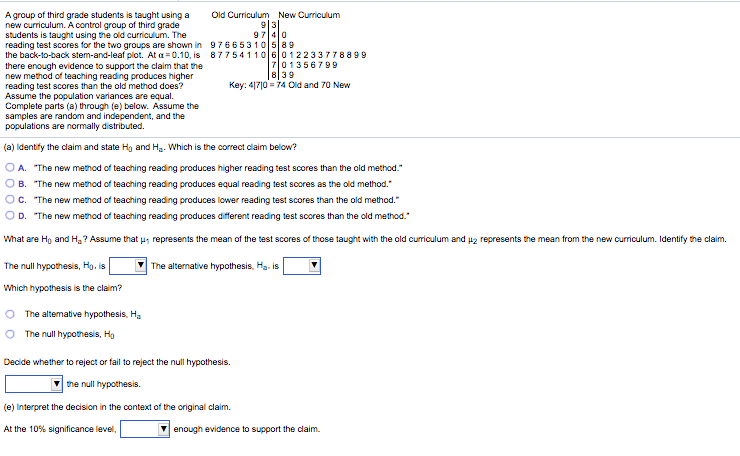
Transcribed Image Text:A group of third grade students is taught using a
new curriculum. A control group of third grade
students is taught using the old curriculum. The
reading test scores for the two groups are shown in 97665310 589
the back-to-back stem-and-leaf plot. At a= 0.10, is 87754110 6012233778899
there enough evidence to support the claim that the
new method of teaching reading produces higher
reading test scores than the old method does?
Assume the population variances are equal.
Complete parts (a) through (e) below. Assume the
samples are random and independent, and the
populations are normally distributed.
Old Curriculum New Curriculum
93
9740
701356799
839
Key: 417|0 - 74 Old and 70 New
(a) Identify the claim and state Hg and Ha. Which is the correct dlaim below?
O A. "The new method of teaching reading produces higher reading test scores than the old method."
B. "The new method of teaching reading produces equal reading test scores as the old method."
Oc. "The new method of teaching reading produces lower reading test scores than the old method."
OD. "The new method of teaching reading produces different reading test scores than the old method."
What are Hg and Ha? Assume that u represents the mean of the test scores of those taught with the old curriculum and u2 represents the mean from the new curriculum. Identify the claim.
The null hypothesis, Hg. is
The alternative hypothesis, Ha. is
Which hypothesis is the claim?
O The altemative hypothesis, Ha
O The null hypothesis, Ho
Decide whether to reject or fail to reject the null hypothesis.
the null hypothesis.
(e) Interpret the decision in the context of the original claim.
At the 10% significance level,
enough evidence to support the claim.
Expert Solution
This question has been solved!
Explore an expertly crafted, step-by-step solution for a thorough understanding of key concepts.

This is a popular solution!

Trending now
This is a popular solution!

Step by step
Solved in 3 steps

Knowledge Booster


Learn more about
Need a deep-dive on the concept behind this application? Look no further. Learn more about this topic, statistics and related others by exploring similar questions and additional content below.Recommended textbooks for you
MATLAB: An Introduction with Applications
Statistics
ISBN:
9781119256830
Author:
Amos Gilat
Publisher:
John Wiley & Sons Inc

Probability and Statistics for Engineering and th…
Statistics
ISBN:
9781305251809
Author:
Jay L. Devore
Publisher:
Cengage Learning

Statistics for The Behavioral Sciences (MindTap C…
Statistics
ISBN:
9781305504912
Author:
Frederick J Gravetter, Larry B. Wallnau
Publisher:
Cengage Learning
MATLAB: An Introduction with Applications
Statistics
ISBN:
9781119256830
Author:
Amos Gilat
Publisher:
John Wiley & Sons Inc
Probability and Statistics for Engineering and th…
Statistics
ISBN:
9781305251809
Author:
Jay L. Devore
Publisher:
Cengage Learning
Statistics for The Behavioral Sciences (MindTap C…
Statistics
ISBN:
9781305504912
Author:
Frederick J Gravetter, Larry B. Wallnau
Publisher:
Cengage Learning

Elementary Statistics: Picturing the World (7th E…
Statistics
ISBN:
9780134683416
Author:
Ron Larson, Betsy Farber
Publisher:
PEARSON

The Basic Practice of Statistics
Statistics
ISBN:
9781319042578
Author:
David S. Moore, William I. Notz, Michael A. Fligner
Publisher:
W. H. Freeman

Introduction to the Practice of Statistics
Statistics
ISBN:
9781319013387
Author:
David S. Moore, George P. McCabe, Bruce A. Craig
Publisher:
W. H. Freeman