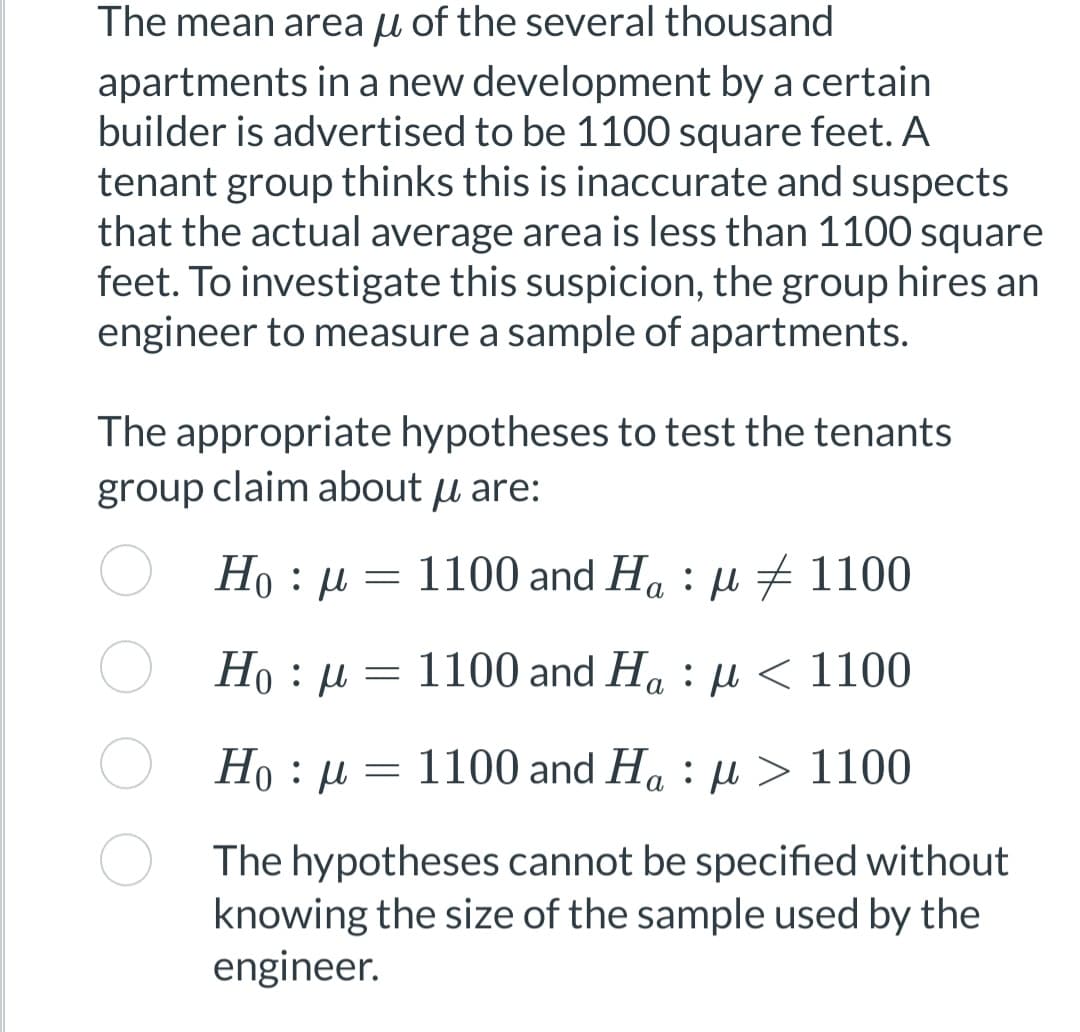
The mean area of the several thousand apartments in a new development by a certain builder is advertised to be 1100 square feet. A tenant group thinks this is inaccurate and suspects that the actual average area is less than 1100 square feet. To investigate this suspicion, the group hires an engineer to measure a sample of apartments. The appropriate hypotheses to test the tenants group claim about u are: Hoμ 1100 and Hau 1100 Ho: μ 1100 and Haμ< 1100 1100 and Haμ > 1100 Ho : μ = = =
Q: How did you get 0.668 for the answer to part A of the question and not the x-table of 1.5 which is…
A:
Q: alculate the five-number summary of the given data.…
A: Given data: 12, 2, 20, 22, 22, 14, 5, 7, 7, 4, 16, 17, 25, 9, 112, 2, 20, 22, 22, 14, 5, 7, 7, 4,…
Q: Consider random samples of size 50 from a population with proportion 0.80 . Find the standard error…
A:
Q: As the pre-test probability of disease increases [ O Both sensitivity and specificity increase O…
A: Epidemiology
Q: is there evidence that the mean life is different from 7520 hours? What is the test statistic?…
A: It is given that Population mean = 7520 Sample mean = 7310 Population standard deviation = 980…
Q: The 20th percentile of weigh is the number of inhabitants ΟΟΟ O200 inhabitants. 320 inhabitants.…
A: Given: number of inhabitance (n)=160020th percentile = 80 kg
Q: We wish to estimate what percent of adult residents in a certain county are parents. Out of 100…
A:
Q: 5) People were asked if they prefer Pepsi or Coke. The results are in the table below. Female Male…
A: ( a ) P( both prefer Pepsi) = ? ( b ) P( Female or Coke ) = ?
Q: When working on a normal distribution other than the standard normal distribution you need to either…
A: Suppose a random variable X, defines the IQ score.
Q: X 0 P(x) 0.25 1 0.3 2 0.2 3 0.25 Find the standard deviation of this probability distribution. Give…
A: From the provided information, x P(x) 0 0.25 1 0.3 2 0.2 3 0.25
Q: The p-value is
A: It is given that the one-sample left-tailed or lower tail hypothesis test. ZSTAT, z = -2.23
Q: Chi-square distribution Suppose that χ2 follows a chi-square distribution with 11 degrees of…
A: Given: Degrees of freedom(df): df=11
Q: A 2009 study to investigate the dominant paws in cats was described in Animal Behaviour (Volume 78,…
A: Work to do in stat key : Under "Bootstrap Confidence Intervals" , choose " Confidence interval for…
Q: Provided below are summary statistics for independent simple random samples from two populations.…
A: To apply the pooled t test and pooled t interval we need to prove that the population variances are…
Q: he method of tree ring dating gave the following years A.D. for an archaeological excavation site.…
A: Given, The method of tree ring dating gave the following years A.D. for an archaeological excavation…
Q: The average cost of tuition plus room and board for a small private liberal arts college is reported…
A: Note: Hey there! Thank you for posting the question. Since your question has more than one question,…
Q: Let x be a continuous random variable that has a normal distribution with u = 50 and a = 8. Find the…
A:
Q: A surgeon would like to know how long it takes, on average, to complete a coronary artery bypass…
A: From the provided information, Sample size (n) = 27 Population standard deviation (σ) = 1.1…
Q: Question 2 Suppose a random variable X has the following density function. fx(x) = 0.3e-ax a)…
A:
Q: i need the answer quickly
A: Events A & B are independent if ?
Q: Heater Wattage Area 1 1000 108 2 750 291 3 1500 100 4 1000 43 5 1250 68 6 1500…
A: Given data: Wattage Area 1000 108 750 291 1500 100 1000 43 1250…
Q: Assume z is a standard normal random variable. Then P(-1.96 ≤z≤-1.4) equals O a..475 O b..8942 O…
A: Given that The Z is a standard normal variable. We need to find area under the values…
Q: Find the z-score that cuts off 65% in the body on the left. (Hint: if you can’t find that EXACT…
A:
Q: Find the probability that a student picked at random will be female or Right- handed? C A random…
A: Probability A probability tells the chances of an event whose occurrence is uncertain. For example,…
Q: 5. Identify the measure of central tendency that is most appropriate to determine the following:…
A: The following are the solution of the above question.
Q: A cereal company wants to see which of two promotional strategies, supplying coupons in a local…
A: Given data: Sales for promotion 1 Sales for promotion 0 169 160 242 209 175 175 253…
Q: A special diet is intended to reduce systolic blood pressure among patients diagnosed with stage 2…
A: Given data,The Null Hypothesis is H0:μ≥150The Alternate Hypothesis is Ha:μ<150n=28x=142s=20Find…
Q: −13,−13,−13,0,0,0,11−13,−13,−13,0,0,0,11 Copy Data Step 1 of 3 : Calculate the value of the…
A: Given data: −13, −13, −13, 0, 0, 0, 11, −13, −13, −13, 0, 0, 0, 11
Q: a-1. Determine the standard error of estimate. (Round your answer to 2 decimal places.) standard…
A:
Q: p(1-P) n Formulas: np; √np(1 - p); Here is the quick link to the scientific calculator , and from…
A: The question is about sampling dist. for popl. prop. Given : Popl. prop. of households spends more…
Q: Complete the table below: Weight (in kg) 40-44 45-49 50-54 Frequency 1 14 15
A: Given frequency distribution table is Weight(in kg) Frequency 40-44 1 45-49 14 50-54 15…
Q: Dandelions are studied for their effects on crop production and lawn growth. In one region, the mean…
A: Given: The mean number of dandelions per square meter is λ = 8 Formula Used: If a random variable X…
Q: ovide a written description of how s of performance. In your respons= bad" item. EXAMPLE: "This iten…
A: The Given figure is To provide a written description of how test the given items.
Q: Find both the x-intercept and the y-intercept of the line given by this equation. (1.8x+2.1y-5.1=0)…
A:
Q: Out of 200 people sampled, 56 preferred Candidate A. Based on this, estimate what proportion of the…
A: Given that n=200 and x=56.
Q: Consider the following data: −9,13,−14,−14,−9,−14,−9−9,13,−14,−14,−9,−14,−9 Copy Data Step 2 of…
A:
Q: In the United States, there has historically been a strong relationship between smoking and…
A: The given chi-square test statistic is, The degree of freedom is,
Q: What is i? 2. What is the upper limit of 65-69? 3. Compute the mean weight of college students. 4.…
A: According to guidelines we solve first three subparts when given multiple subparts.
Q: Select the best response. We take a simple random sample (SRS) from a population to study the effect…
A: Design of experiment
Q: A particular fruit's weights are normally distributed, with a mean of 648 grams and a standard…
A: Given distribution is normally distributed Let, X: Fruit's weights Mean=μ=648 Standard…
Q: and y-intercepts of a line given the equation in standard form Find both the x-intercept and the…
A: Given data,The equation is 2.9x+9.9y-9.5=0Find both the x-intercept and the y-intercept
Q: Q8. Which of these is not a condition for Z test? Quantitative response Large sample size σ unknown…
A: Z-test is used to check whether the mean of two datasets are different or not. The conditions…
Q: A study published in 2007 by Christopher Johnson, professor of music education and music therapy at…
A: Note that, the researcher gave students standardized tests, hence there is no chance of partiality…
Q: A gun club performed an experiment with a randomly selected group of first time shooters. The…
A:
Q: Click to Copy-and-Paste Data A student calculates a linear model y = H+ (Please show your answers to…
A:
Q: find the p-value accurate to 4 decimal places. p-value =
A: It is given that the right-tailed test with test statistic z = 1.924.
Q: 1) Explain the possible ramifications of using a global per capita average for CO₂ emissions in…
A: Given figure shows the regression line for the emission of CO2 (c) Meaning of Australia to lie above…
Q: Deon wants to advertise how many chocolate chips are in each Big Chip cookie at his bakery. He…
A:
Q: In a box, there are 8 red, 7 blue and 6 green balls. One bal' is picked up randomly. What is the…
A: In a box,there are 8 red , 7 blue and 6 green balls.total number of balls in a box=21
Q: Match each scatterplot shown below with one of the four specifi correlations. Do 88 of a. 0.74 b.…
A: Correlation: If the scatter plot shows a pattern of upward or downward straight line, it means that…
Urgent help please
Step by step
Solved in 2 steps with 2 images
- A research center claims that 30% of adults in a certain country would travel into space on a commercial flight if they could afford it. In a random sample of 1200 adults in that country, 33% say that they would travel into space on a commercial flight if they could afford it. At α=0.05, is there enough evidence to reject the research center's claim? Complete parts (a) through (d) below. Identify the P-value?Each day for 200 days, a quality engineer samples 144 fuses rated at 15 A and measures the amperage at which they burn out. He performs a hypothesis test of H0 : μ = 15 versus H1 : μ ≠ 15, where μ is the mean burnout amperage of the fuses manufactured that day. a) On 10 of the 200 days, H0 is rejected at the 5% level. Does this provide conclusive evidence that the mean burnout amperage was different from 15 A on at least one of the 200 days? Explain. b) Would the answer to part (a) be different if H0 had been rejected on 20 of the 200 days? Explain.A researcher is using a two-tailed hypothesis test with α = 0.05 to evaluate the effect of a treatment. If the boundaries for the critical region are t = ± 2.080, then how many individuals are in the sample?
- A researcher is using a two-tailed hypothesis test with α = 0.01 to evaluate the effect of a treatment. If theboundaries for the critical region are t = ± 2.845, then how many individuals are in the sampleIn 2002 a statistician named Fukuda found the following in Japan: Out of 565 births where both parents smoked more than a pack a day, 255 were boys. Out of 3602 births where both parents didn’t smoke, 1975 were boys. At ∝= 0.05, can we claim that there is a smaller propor)on of boys with parents who are smokers? Test using: a.) a hypothesis test b.) an appropriate CIA nationwide study of undergraduate students reported that the mean number of drinks consumed per week during the spring semester is 7.96. The mean number of drinks consumed per week at USC is 7.64 (s.d.=2.55, N=412 Health services is concerned that USC students are consuming significantly more alcohol per week than the national average. Using an alpha level of .05, Is there sufficient evidence to be concerned? Be sure to select the correct critical value for the alternative hypothesis, and then use this evidence to make your conclusion
- a cereal company claims that the mean weight of the cereal in its packets is at least 14oz. express the null hypothesis and the alternatvie hypothesis in symbolic formCalculateaconfidenceinterval for the me-dian ofthe second population.Select your confidenc eleve land reportit with your answer.??The researchers wrote: “On the basis of a pilot test indicating a Cohen’s d of 0.175, we set a target sample size of 1,000 participants, yielding 75% power to detect a small effect size after allowing for 100 exclusions (10%)” (Catapano et al., 2019, p. 426). A “pilot test” is an initial, smaller study usually conducted to gather information to guide the actual, larger study. By “exclusions,” the researchers meant participant data that they didn’t use for some reason—for example, because the participant failed to answer all of the questions. The findings from the pilot test, or initial study, had a Cohen’s d of 0.175, a small effect size. Why is this information useful for planning the sample size for the main study? A.Researchers now know that there is likely to be only a small effect, so it’s not worth conducting the study after all. B.Researchers need to estimate the size of the effect they hope to detect so as to determine how many participants will be necessary to…
- When determining whether grounding accidents and hull failures result in different spillage (is there a difference between spills caused by grounding or hull failures) would I use a two tail t test to decide this?A research center claims that more than 32% of employees in a certain country have changed jobs in the past three years. In a random sample of 360 people from that country, 126 have changed jobs in the past three years. At α=0.05, is there enough evidence to support the center's claim? Complete parts (a) through (e) belowA tax accountant would like to test the claim that the proportion of individuals who owe when filing their taxes is less than 0.20. If the z− test statistic was calculated as z=−2.11, does the tax accountant have enough evidence to reject the null hypothesis? Assume α=0.005. Move the blue dot to choose the appropriate test (left-, right, or two-tailed). Then, use the graph below to show the test statistic, p-value, and the rejection region to make a conclusion about the hypothesis test. powered by Move the blue dot to choose the appropriate test α=0.01 α=0.025 α=0.05 α=0.1 Significance level = 0.01 Select the correct answer below: There is enough evidence to suggest the proportion of individuals who owe when filing their taxes is less than 0.20. There is not enough evidence to suggest the proportion of individuals who owe when filing their taxes is less than 0.20. There is enough evidence to suggest the proportion of individuals who owe when filing their taxes is greater than 0.20.…