A horizontal analysis of the balance sheet would show (select all that apply): A Total stockholders' equity increased 44.16 % from 20X1 to 20x2. B. Total assets increased 17.95% from 20X1 to 20X2. C. The debt ratio for 20X2 is 51.74%. OD. Net income increased 36% from 20X1 to 20X2. E. Current assets increased 50% from 20X1 to 20X2
A horizontal analysis of the balance sheet would show (select all that apply): A Total stockholders' equity increased 44.16 % from 20X1 to 20x2. B. Total assets increased 17.95% from 20X1 to 20X2. C. The debt ratio for 20X2 is 51.74%. OD. Net income increased 36% from 20X1 to 20X2. E. Current assets increased 50% from 20X1 to 20X2

Financial Accounting
14th Edition
ISBN:9781305088436
Author:Carl Warren, Jim Reeve, Jonathan Duchac
Publisher:Carl Warren, Jim Reeve, Jonathan Duchac
Chapter17: Financial Statement Analysis
Section: Chapter Questions
Problem 17E

Related questions
Question
100%
Help
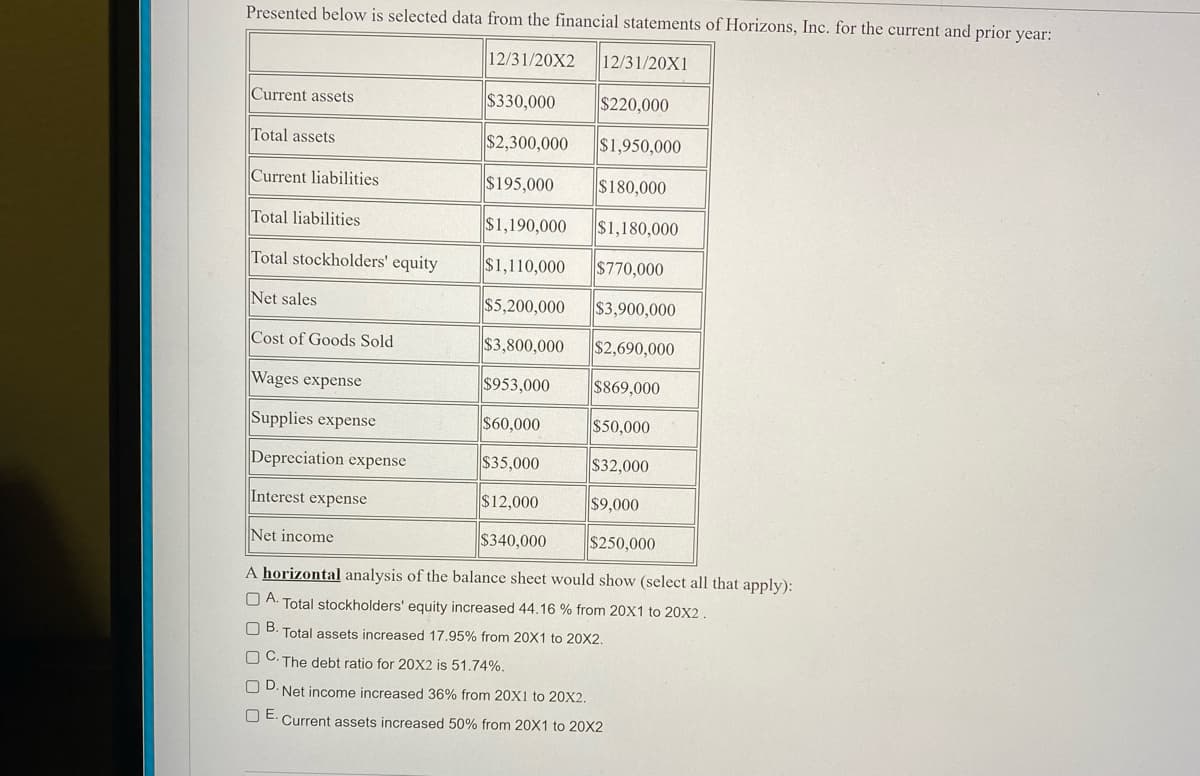
Transcribed Image Text:Presented below is selected data from the financial statements of Horizons, Inc. for the current and prior year:
12/31/20X2 12/31/20X1
Current assets
$330,000
$220,000
Total assets
$2,300,000 $1,950,000
Current liabilities
$195,000
$180,000
Total liabilities
$1,190,000
$1,180,000
Total stockholders' equity
$1,110,000
$770,000
Net sales
$5,200,000
$3,900,000
Cost of Goods Sold
$3,800,000
$2,690,000
Wages expense
$953,000
$869,000
Supplies expense
$60,000
$50,000
Depreciation expense
||$35,000
$32,000
Interest expense
$12,000
$9,000
Net income
$340,000
$250,000
A horizontal analysis of the balance sheet would show (select all that apply):
A Total stockholders' equity increased 44.16 % from 20X1 to 20X2.
OB. Total assets increased 17.95% from 20X1 to 20X2.
O C.
The debt ratio for 20X2 is 51.74%.
OD. Net income increased 36% from 20X1 to 20x2.
OE. Current assets increased 50% from 20X1 to 20X2
Expert Solution
This question has been solved!
Explore an expertly crafted, step-by-step solution for a thorough understanding of key concepts.

This is a popular solution!

Trending now
This is a popular solution!

Step by step
Solved in 2 steps

Recommended textbooks for you
Financial Accounting
Accounting
ISBN:
9781305088436
Author:
Carl Warren, Jim Reeve, Jonathan Duchac
Publisher:
Cengage Learning

Managerial Accounting
Accounting
ISBN:
9781337912020
Author:
Carl Warren, Ph.d. Cma William B. Tayler
Publisher:
South-Western College Pub

Managerial Accounting: The Cornerstone of Busines…
Accounting
ISBN:
9781337115773
Author:
Maryanne M. Mowen, Don R. Hansen, Dan L. Heitger
Publisher:
Cengage Learning
Financial Accounting
Accounting
ISBN:
9781305088436
Author:
Carl Warren, Jim Reeve, Jonathan Duchac
Publisher:
Cengage Learning
Managerial Accounting
Accounting
ISBN:
9781337912020
Author:
Carl Warren, Ph.d. Cma William B. Tayler
Publisher:
South-Western College Pub
Managerial Accounting: The Cornerstone of Busines…
Accounting
ISBN:
9781337115773
Author:
Maryanne M. Mowen, Don R. Hansen, Dan L. Heitger
Publisher:
Cengage Learning

Financial And Managerial Accounting
Accounting
ISBN:
9781337902663
Author:
WARREN, Carl S.
Publisher:
Cengage Learning,

Survey of Accounting (Accounting I)
Accounting
ISBN:
9781305961883
Author:
Carl Warren
Publisher:
Cengage Learning

Financial Accounting: The Impact on Decision Make…
Accounting
ISBN:
9781305654174
Author:
Gary A. Porter, Curtis L. Norton
Publisher:
Cengage Learning