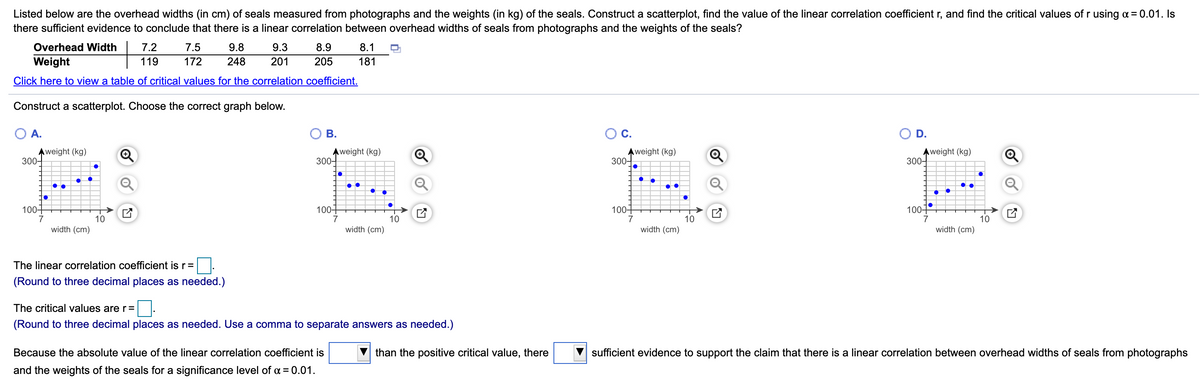
Listed below are the overhead widths (in cm) of seals measured from photographs and the weights (in kg) of the seals. Construct a scatterplot, find the value of the linear correlation coefficient r, and find the critical values of r using a = 0.01. Is there sufficient evidence to conclude that there is a linear correlation between overhead widths of seals from photographs and the weights of the seals? Overhead Width | 7.2 7.5 Weight Click here to view a table of critical values for the correlation coefficient, 9.8 248 9.3 8.9 8.1 O 181 | 119 172 201 205 Construct a scatterplot. Choose the correct graph below. OA. OB. Oc. OD. Aweight (kg) 300- Aweight (kg) 300 Aweight (kg) 300 Aweight (kg) 300- 100 100- 100 100 10 width (cm) 10 width (cm) width (cm) width (cm) The linear correlation coefficient is r=D (Round to three decimal places as needed.) The critical values are r=. (Round to three decimal places as needed. Use a comma to separate answers as needed.) V than the positive critical value, there V sufficient evidence to support the claim that there is a linear correlation between overhead widths of seals from photographs Because the absolute value of the linear correlation coefficient is and the weights of the seals for a significance level of a = 0.01.


Correlation
Correlation defines a relationship between two independent variables. It tells the degree to which variables move in relation to each other. When two sets of data are related to each other, there is a correlation between them.
Linear Correlation
A correlation is used to determine the relationships between numerical and categorical variables. In other words, it is an indicator of how things are connected to one another. The correlation analysis is the study of how variables are related.
Regression Analysis
Regression analysis is a statistical method in which it estimates the relationship between a dependent variable and one or more independent variable. In simple terms dependent variable is called as outcome variable and independent variable is called as predictors. Regression analysis is one of the methods to find the trends in data. The independent variable used in Regression analysis is named Predictor variable. It offers data of an associated dependent variable regarding a particular outcome.

Step by step
Solved in 2 steps with 2 images


