A large beverage company would like to use a statistical process control to monitor how much liqui beverage it puts into each 350 ml bottle. The company operated its bottle filling line under carefu supervision, confident that the line was under complete control, for seven hours. Each hour, a sample of 2 bottles was taken off the line and the amount of liquid in each bottle was carefully measured. This is th resulting data: Sample No. Sample Sample Mean Range #1 350.85 ml 0.6 ml # 2 350.80 ml 0.8 ml
A large beverage company would like to use a statistical process control to monitor how much liqui beverage it puts into each 350 ml bottle. The company operated its bottle filling line under carefu supervision, confident that the line was under complete control, for seven hours. Each hour, a sample of 2 bottles was taken off the line and the amount of liquid in each bottle was carefully measured. This is th resulting data: Sample No. Sample Sample Mean Range #1 350.85 ml 0.6 ml # 2 350.80 ml 0.8 ml

Glencoe Algebra 1, Student Edition, 9780079039897, 0079039898, 2018
18th Edition
ISBN:9780079039897
Author:Carter
Publisher:Carter
Chapter10: Statistics
Section10.6: Summarizing Categorical Data
Problem 10CYU

Related questions
Question
Transcribed Image Text:204
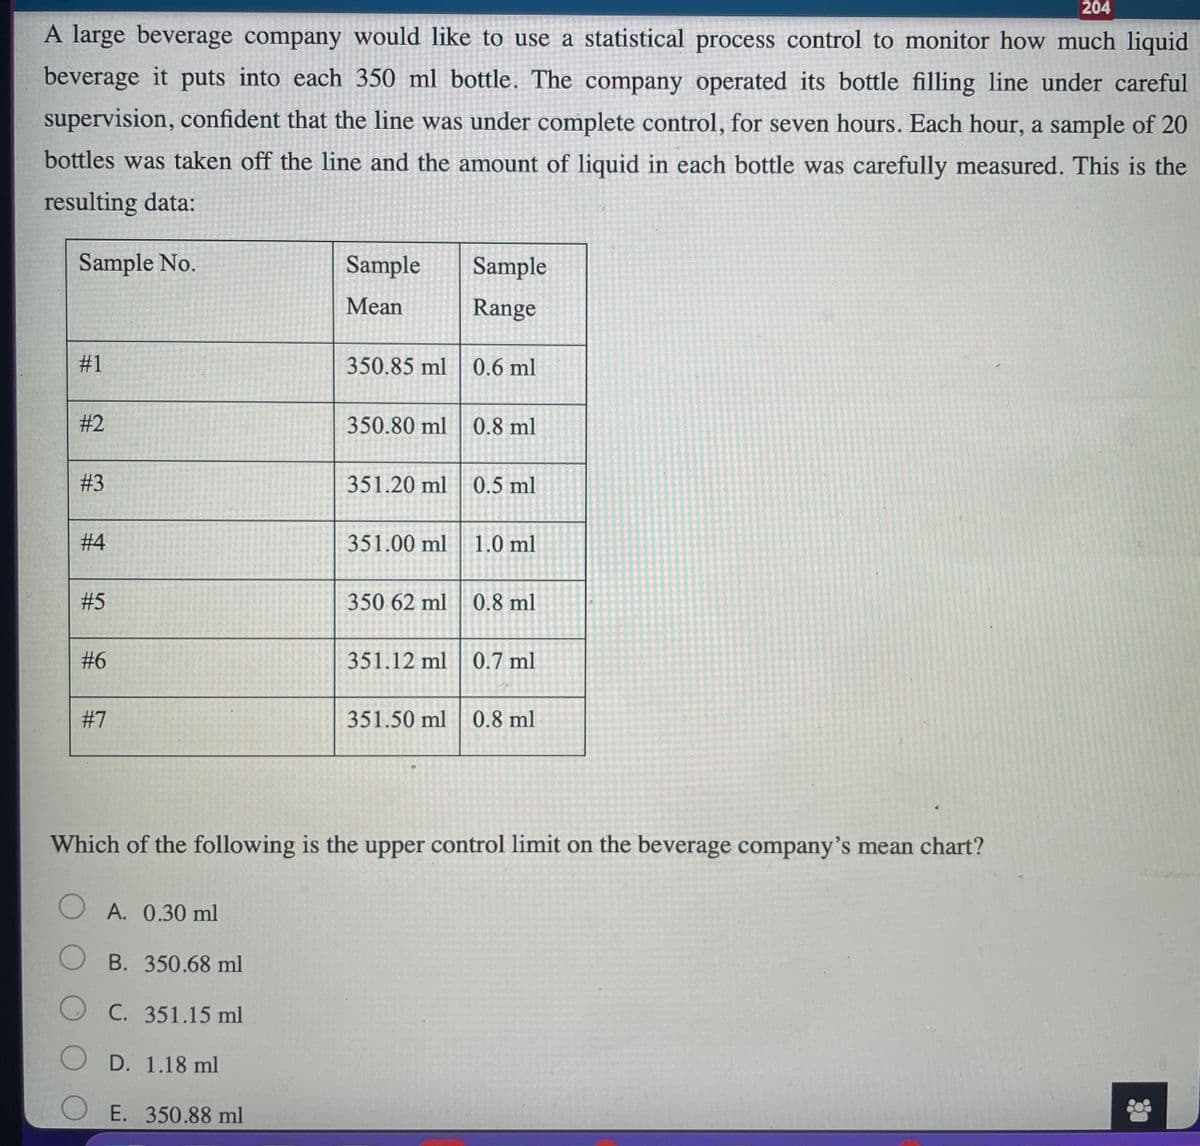
A large beverage company would like to use a statistical process control to monitor how much liquid
beverage it puts into each 350 ml bottle. The company operated its bottle filling line under careful
supervision, confident that the line was under complete control, for seven hours. Each hour, a sample of 20
bottles was taken off the line and the amount of liquid in each bottle was carefully measured. This is the
resulting data:
Sample No.
Sample
Sample
Mean
Range
#1
350.85 ml
0.6 ml
#2
350.80 ml 0.8 ml
#3
351.20 ml 0.5 ml
# 4
351.00 ml
1.0 ml
#5
350 62 ml | 0.8 ml
#6
351.12 ml| 0.7 ml
#7
351.50 ml 0.8 ml
Which of the following is the upper control limit on the beverage company's mean chart?
A. 0.30 ml
O B. 350.68 ml
O C. 351.15 ml
O D. 1.18 ml
O E. 350.88 ml
Expert Solution
This question has been solved!
Explore an expertly crafted, step-by-step solution for a thorough understanding of key concepts.

This is a popular solution!

Trending now
This is a popular solution!

Step by step
Solved in 2 steps

Recommended textbooks for you
Glencoe Algebra 1, Student Edition, 9780079039897…
Algebra
ISBN:
9780079039897
Author:
Carter
Publisher:
McGraw Hill

Holt Mcdougal Larson Pre-algebra: Student Edition…
Algebra
ISBN:
9780547587776
Author:
HOLT MCDOUGAL
Publisher:
HOLT MCDOUGAL
Glencoe Algebra 1, Student Edition, 9780079039897…
Algebra
ISBN:
9780079039897
Author:
Carter
Publisher:
McGraw Hill
Holt Mcdougal Larson Pre-algebra: Student Edition…
Algebra
ISBN:
9780547587776
Author:
HOLT MCDOUGAL
Publisher:
HOLT MCDOUGAL