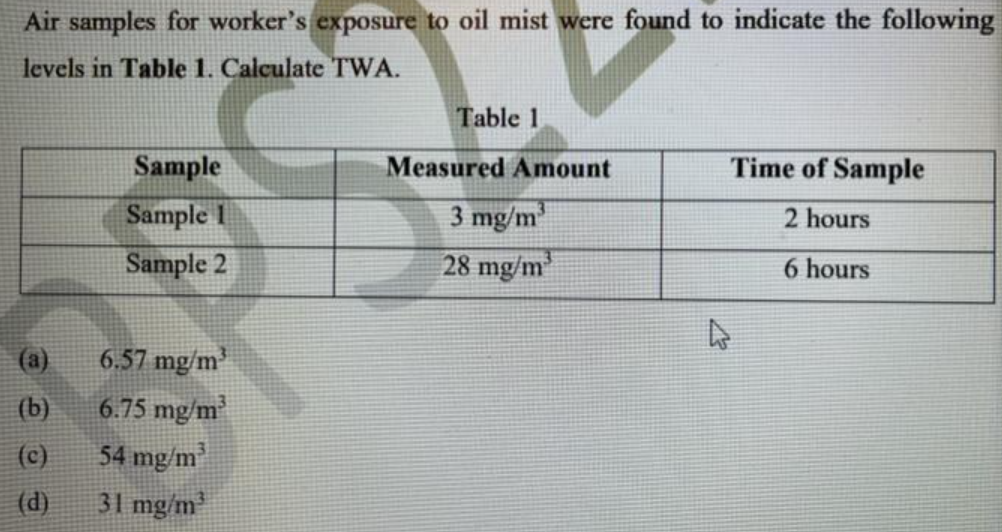
Air samples for worker's exposure to oil mist were found to indicate the followir levels in Table 1. Calculate TWA. Table 1 Sample Measured Amount Time of Sample 3 mg/m 28 mg/m' Sample I 2 hours Sample 2 6 hours (a) 6.57 mg/m' 6.75 mg/m 54 mg/m (b) (c) 31 maán3


Q: A transportation engineering study requires the calculation of the total number of cars that pass…
A: The data is given by: x 0 2 4 5 6 7 8 9 10.5 f(x) 2 2 0 2 6 7 23 11 4 x 11.5 12.5 14 16 17 18…
Q: Q.1 An Electronic equipment used for the analysis and storage of the data in an industry has three…
A: We can calculate reliability from failure rates, reliability is complementary to failure. R = 1-F
Q: An article in the Tappi Journal (March, 1986) presented data on green liquor Na2S concentration (in…
A:
Q: A photoconductor film is manufactured at a nominal thickness of 25 mils. The product engineer wishes…
A: Given: Mean Standard deviation Sample size For 25 mils x¯1=1.13 s1=0.11 n1=8 For 20 mils…
Q: When performing the Levene’s test of homogeneity what do we want when using an alpha level of .05?
A: Solution: Levene's test of homogenity that is equality of variance test: To test the hypothesis…
Q: The figure below is a partition curve for a heavy media cyclone processing coal. a) What is the d50…
A: Normalized error is a statistical evaluation used to compare proficiency testing results where the…
Q: The rare earth element gadolinium is often used as a contrasting agent for MRIS. The concentration…
A: Solution
Q: The table below shows the results from the specific gravity (S.G.) test performed in a soil…
A: specific gravity samples cumulative sample 2.30-2.39 1 1 2.40-2.49 2 3…
Q: To examine the potential effects on the transmission of dengue, Bian et al. (2010) infected…
A: H0 : The distribution of viral titers is the same between the two strains H1 : The distribution of…
Q: The rare earth element gadolinium is often used as a contrasting agent for MRIS. The concentration…
A:
Q: The differential is a standard measurement made during a blood test. It consists of classifying…
A: Hello! As you have posted more than 3 sub parts, we are answering the first 3 sub-parts. In case…
Q: Data from the National Vital Statistics Report indicate that there were 3,880,894 births in the…
A: Solution From the given data The total number of birth is 3880894 The first group total number of…
Q: Radon is a colorless, odorless, invisible gas that seeps into residential homes and has been linked…
A: As per Bartleby's answering policy, we can answer only one question with a maximum of three…
Q: to test if these results says that the average of daily calcium take from low income adults is below…
A: Given : μ0 = 800 Sample Mean (Xˉ)(\bar X) = 755.3 Sample Standard Deviation (s)(s) = 239.3 Here…
Q: The Kyoto Protocol was signed in 1997, and required countries to start reducing their carbon…
A: From the given information, the claim of the problem is the mean CO2 emission is lower in 2010 than…
Q: A new starch polymer foam with high shock absorbent properties is expected to perform better the old…
A: Null Hypothesis: H0: The new foam performs not better than the old foam. Alternative Hypothesis:…
Q: 10. What is S/N ratio for a system that has a pressure ofx psi and a sample standard deviat Vx for…
A: Given: To find S/N ratio has a pressure of x2 psi and a sample standard deviation of x for 1/x.
Q: Samples are collected from the River X and pH values are observed. 9 different pH values are listed…
A: Introduction: The formula for Bowley’s coefficient of skewness is: SkB = (Q3 –2Q2 + Q1) / (Q3 – Q1).…
Q: find the out of control average run length for the control chart for defects when: shifted rate of…
A: Given, Control chart for defects given shifted rate= 6.4 UCL=2.61 LCL=0.2
Q: The systolic blood pressure dataset (in the third sheet of the spreadsheet linked above) contains…
A: The variables x and y are average number of employees in a group health insurance plan and average…
Q: Radon is a colorless, odorless, invisible gas that seeps into residential homes and has been linked…
A: c) Consider that μ is the true mean of radon level.
Q: Can you use OLS to estimate 3 the model = e° ? Yt
A: Given yt=eβxtzt
Q: Table 1: Systolic blood pressure from nine patients with a certain condition and 11 healthy…
A: The descriptive analysis is conducted using EXCEL. The software procedure is given below: Enter the…
Q: 1. Incide nce rate in the last influenza epidemic was found to be 50 per thousand (S%) of the…
A: Concept: for this question, we need to employ Cochran’s Sample Size Formula given by:…
Q: A study was made on the amount of converted sugar in a certain process at various temperatures. The…
A: From the given information and set of data the regression equation can be obtained by as follows:…
Q: Can we conclude at the 0.05 level of significance that the abrasive wear of material 1 exceeds that…
A: Given that For material 1, Sample size n1 = 12, sample mean = 85 and Sample SD = 4 For material 2,…
Q: Is there enough evidence to conclude that the average thicknesses of sheets produced by the two…
A:
Q: A firm is investigating the formulation of synthetic fibres used to make cloth. The results from…
A: Null Hypothesis: H0: There is no difference in the overall strength of the cloth between the five…
Q: 138 patients who received 10-mg doses of a drug daily, 33 reported headache as a side effect. Obtain…
A: We have given that Sample size n =138 Favorable cases x =33
Q: 1) The laser offset is known to have a normal distribution with population mean of 100 nm and…
A:
Q: A production process has capability indices Cp = 0.5 and Cpk = 0.4. What is the corresponding defect…
A: Given: Cp=0.5 and Cpk=0.4.
Q: In relation to the Sustainable Development Goals of the United Nations, one of the critical measures…
A: Denote μ as the true mean concentrations of find particulate matter in air.
Q: A study sought to demonstrate that soy beans inoculated with nitrogen-fixing bacteria yield more.…
A: State the hypotheses. That is, there is no evidence that the mean pod weight exceeds the mean of…
Q: Twenty-five samples, each of size 5, were selected from a process that was in control. Thesum of all…
A: The sum of all the data collected is 677.5 and the number of samples is 25 for each of size of 5.
Q: Determine: a) chain absolute increase for July: b) base relative increase for August: c)…
A: Given the data as i ti yi (PLN) 1 May 9 2 June 8 3 July 10 4 August 12 5 September…
Q: In a trial of 218 patients who received 10-mg doses of a drug daily, 48 reported headache as a side…
A: Here Given No of Sample size = n= 218 No of patient had side effect =x=48
Q: A state agency requires a minimum of 5 parts per million (ppm) of dissolved oxygen in order for the…
A: It is given that the readings of six water specimens taken from a river at a specific location…
Q: The distribution of weights for 12–month–old baby boys in the US is approximately normal with mean μ…
A: Let X be the distribution of weights for 12–month–old baby boys in the US X~ N( μ = 22.5 pounds,σ =…
Q: I need help with part (c) only, I need t statistic and p value. Mist (airborne droplets or aerosols)…
A: Part (c):The regression analysis is conducted here by using EXCEL. The software procedure is given…
Q: In a certain jurisdiction, all students in Grade Three are required to take a standardized test to…
A: Given Information: The independent variable X is 'perbelowpoverty' and the dependent variable Y is…
Q: To examine the potential effects on the transmission of dengue, Bian et al. (2010) infected…
A: Given: Given: WB1 Wild 8 11.3 5.9 10.8 4.4 9.4 4.4 6.5 2.4 6.3 0 5.9 0 4.7 0 4.2
Q: Calculate the true net counting activity and its standard percent error for a sample that gave…
A: The true net counting activity and its standard percent error for a sample that gave 7000count in 2…
Q: The extent of disease transmisSion can be affected greatly by the viability of infectious organisms…
A: The given data is, Class Time,x(in minutes) Biological Recovery(%) 1 0 70.6 2 5 52 3 10…
Q: i have attached a picture
A: Correct option: option 5
Q: The measurements of suspended solid material concentration in water samples is illustrated in the…
A: A box plot is a graphical method for depicting groups of numerical data through their quartiles. It…
Q: 1. What is the difference between the t-statistic you calculate from your sample and teritical that…
A: We have given that the statement about t-statistic calculated from the sample and t-critical value…
Q: (a) Determine the proportion of wafers that exceeds 0.2125 micrometers of photoresist thickness.…
A: The thickness of photoresist applied to wafers in semiconductor manufacturing at a particular…
Q: The toco toucan, the largest member of the toucan family, possesses the largest beak relative to…
A: The regression analysis is conducted using EXCEL. The software procedure is given below: Enter the…
Q: It is desired to compare the measurement results of the same machine in 3 different shifts for 30…
A: Here we are comparing the measurement of the same machine in 3 different shifts for 30 days. Only…
Q: 16) Unfortunately, arsenic occurs naturally in some ground water (Reference: Union Carbide Technical…
A: Note: You have solved part (a) correctly. As given, a random sample of 37 tests gave a sample…

Step by step
Solved in 2 steps

- To seethe effect of a relatively small error in the estimate of the amountof carbon-14 in a sample being dated, consider this hypotheticalsituation: A bone fragment found in central Illinois in the year 2000 contains 17% of its original carbon-14 content. Estimate the year the animal died.Calculate the average values of the Cp and Cpk capabil-ity indices for the BOD data , assuming that LSL=5 mg/L and USL=35 mg/L. Do these val-ues of the indices indicate that the process performance is satisfactory?A worker with a weight of 65 kg and a body surface area of 1.74 , performs physical work activities in several work environments as shown in the following table. The work activities of these workers require energy and a measured metabolic rate of 400 W/m2. During their work activities, the worker wears a coverall made of polyolefin and wears a headgear (1) Calculate the average WBGT of the work environment. (2) Perform an analysis related to the heat stress experienced by the worker, if the worker performs his work activities for 75% of his total working time and the rest is rest, (note: use TLV from ACGIH and ISO 7243)
- your car is more crowded than you think. table 5.8 reports results from a 1969 personal transportation survey on "home-to-work" trips in metropolitan areas. show that the average number of riders in the car of a typical commuter is 1.9.(a) Calculate a 95% two-sided CI for the true average bond strength. (b) Calculate a 95% two-sided CI for the proportion of all such bonds whosestrength values would exceed 10. show major intermediate steps.Your state is considering raising the legal age for consumption of alcoholic beverages to 21 years old. How large a sample suze must be taken to make an estimate of true proportion of citizens who favor this move? The error should be no more than .01 with 99% confiden
- Much concern has been expressed regarding the practice of using nitrates as meat preservatives. In one study involving possible effects of these chemicals, bacteria cultures were grown in a medium containing nitrates. The rate of uptake of radio-labeled amino acid (in dpm, disintegrations per minute) was then determined for each culture, yielding the following observations. 7,255 6,875 9,637 6,863 9,098 5,846 8,954 7,979 7,068 7,498 7,882 8,179 7,528 8,728 7,469 Suppose that it is known that the mean rate of uptake for cultures without nitrates is 8,000. Do the data suggest that the addition of nitrates results in a decrease in the mean rate of uptake? Test the appropriate hypotheses using a significance level of 0.10. Find the test statistic and P-value. (Use technology to calculate the P-value. Round your test statistic to two decimal places and your P-value to three decimal places.) t= P-value= State your conclusion. Reject H0. We have convincing evidence that the mean rate of…The article “Measuring and Understanding the Aging of Kraft Insulating Paper in Power Transformers” (IEEE Electrical Insul. Mag., 1996: 28– 34) contained the following observations on degree of polymerization for paper specimens for which viscosity times concentration fell in a certain middle range: 418, 434, 454, 421, 437, 463, 421, 439, 465, 422, 446, 425, 447, 427, 448, 431, 453 (a) Calculate a 99% confidence interval for the true average degree of polymerization. (b) Does the confidence interval suggest that μ = 435 is a plausible value for the true average degree of polymerization? (c) Does the confidence interval suggest that μ = 460 is a plausible value for the true average degree of polymerization?The molecular weight of a particular polymer should fall between 750 and 1,035. Thirty samples of this material were analyzed with the results X-bar = 902 and s = 90. Assume that molecular weight is normally distributed.
- The EPA Risk Management Plan (RMP) defines a worst-case scenario as the catastrophic release of the entire process inventory in a 10min period (assumed to be a continuous release). The dispersion calculations must be performed assuming F stability and 1.5 m/s wind speed. As part of the RMP rule, each facility must determine the downwind distance to a toxic endpoint. These results must be reported to the EPA and to the surrounding community. A plant has a 100lb tank of anhydrous hydrogen fluoride. The toxic endpoint is specified in the RMP as 0.016 mg/L. Consider the EPA worst case release scenario described above (assume rural conditions) and consider in particular the footprint of the toxic cloud at ground level. (1) Determine the size of the toxic cloud in the downwind direction. (2) Determine the maximum thickness of the toxic cloud in the crosswind directionAn assemb ly-line worker at Joseph Milner'sFabrication Shop inserts Pa rt A into Part B. A time study wasconducted and produced the fo llowing results in seconds: 8.4, 8.6,8.3, 8.5, 8.7, 8.5. What is the average cycle time?A random sample of 25 tires gave the average life as 38000 km and S.D. as 5000 km. Can it be concluded that the sample is drawn from a population with a mean life of 40000 km?