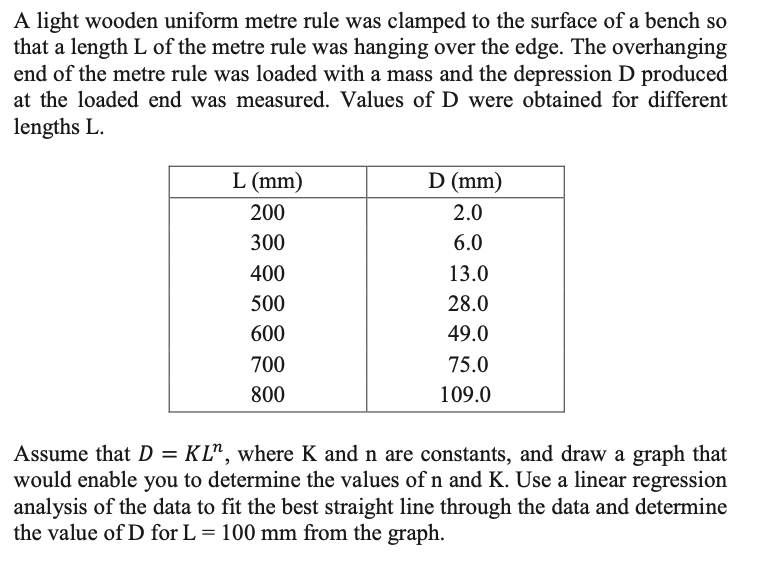
A light wooden uniform metre rule was clamped to the surface of a bench so that a length L of the metre rule was hanging over the edge. The overhanging end of the metre rule was loaded with a mass and the depression D produced at the loaded end was measured. Values of D were obtained for different lengths L. L (mm) D (mm) 200 2.0 300 6.0 400 13.0 500 28.0 600 49.0 700 75.0 800 109.0 Assume that D = KL", where K and n are constants, and draw a graph that would enable you to determine the values of n and K. Use a linear regression analysis of the data to fit the best straight line through the data and determine the value of D for L = 100 mm from the graph.
A light wooden uniform metre rule was clamped to the surface of a bench so that a length L of the metre rule was hanging over the edge. The overhanging end of the metre rule was loaded with a mass and the depression D produced at the loaded end was measured. Values of D were obtained for different lengths L. L (mm) D (mm) 200 2.0 300 6.0 400 13.0 500 28.0 600 49.0 700 75.0 800 109.0 Assume that D = KL", where K and n are constants, and draw a graph that would enable you to determine the values of n and K. Use a linear regression analysis of the data to fit the best straight line through the data and determine the value of D for L = 100 mm from the graph.

Physics for Scientists and Engineers
10th Edition
ISBN:9781337553278
Author:Raymond A. Serway, John W. Jewett
Publisher:Raymond A. Serway, John W. Jewett
Chapter12: Static Equilibrium And Elasticity
Section: Chapter Questions
Problem 27AP: The lintel of prestressed reinforced concrete in Figure P12.27 is 1.50 m long. The concrete encloses...

Related questions

Question
Hi,
Please pay attention to what the question is asking. It clearly states to draw a graph and to fit the best straight like through the data.
Thanks in advance
Transcribed Image Text:A light wooden uniform metre rule was clamped to the surface of a bench so
that a length L of the metre rule was hanging over the edge. The overhanging
end of the metre rule was loaded with a mass and the depression D produced
at the loaded end was measured. Values of D were obtained for different
lengths L.
L (mm)
D (mm)
200
2.0
300
6.0
400
13.0
500
28.0
600
49.0
700
75.0
800
109.0
Assume that D = KL", where K and n are constants, and draw a graph that
would enable you to determine the values of n and K. Use a linear regression
analysis of the data to fit the best straight line through the data and determine
the value of D for L = 100 mm from the graph.
Expert Solution
This question has been solved!
Explore an expertly crafted, step-by-step solution for a thorough understanding of key concepts.

Step by step
Solved in 4 steps with 3 images

Knowledge Booster


Learn more about
Need a deep-dive on the concept behind this application? Look no further. Learn more about this topic, physics and related others by exploring similar questions and additional content below.Recommended textbooks for you
Physics for Scientists and Engineers
Physics
ISBN:
9781337553278
Author:
Raymond A. Serway, John W. Jewett
Publisher:
Cengage Learning

Physics for Scientists and Engineers with Modern …
Physics
ISBN:
9781337553292
Author:
Raymond A. Serway, John W. Jewett
Publisher:
Cengage Learning

College Physics
Physics
ISBN:
9781285737027
Author:
Raymond A. Serway, Chris Vuille
Publisher:
Cengage Learning
Physics for Scientists and Engineers
Physics
ISBN:
9781337553278
Author:
Raymond A. Serway, John W. Jewett
Publisher:
Cengage Learning
Physics for Scientists and Engineers with Modern …
Physics
ISBN:
9781337553292
Author:
Raymond A. Serway, John W. Jewett
Publisher:
Cengage Learning
College Physics
Physics
ISBN:
9781285737027
Author:
Raymond A. Serway, Chris Vuille
Publisher:
Cengage Learning

Physics for Scientists and Engineers: Foundations…
Physics
ISBN:
9781133939146
Author:
Katz, Debora M.
Publisher:
Cengage Learning

Physics for Scientists and Engineers, Technology …
Physics
ISBN:
9781305116399
Author:
Raymond A. Serway, John W. Jewett
Publisher:
Cengage Learning

University Physics Volume 1
Physics
ISBN:
9781938168277
Author:
William Moebs, Samuel J. Ling, Jeff Sanny
Publisher:
OpenStax - Rice University