A machine fills 12-ounce botles with soda. For the machine to function properly, the standard deviation of the population must be less than 0.03 ounce. A random sample of 8 bottles is selected, and the number of ounces of soda in each botle is given. At a 0.05, can we reject the claim that the machine is functioning properly? Use the P-value method. 12.1 12.08 12.01 11.99 11.94 11.97 11.99 11.93 O Since P-value > 0.05, reject the null hypothesis. There is enough evidence to reject the claim that the standard deviation is les than - equal to 0.03 ounce. O Since P-value <0.05, reject the null hypothesis. There is enough evidente to reject the claim that the standard deviation is less than equal to 0.03 ounce. O Since P-value> 0.05, do not reject the null hypothesis. There is not enough evidence to reject the claim that the standard deviation less than or equal to 0.03 ounce. O Since P-value<0.05, do not reject the null'hypothesis. There is not enough evidence to reject the claim that the standard deviation less than or equal to 0.03 ounce.
A machine fills 12-ounce botles with soda. For the machine to function properly, the standard deviation of the population must be less than 0.03 ounce. A random sample of 8 bottles is selected, and the number of ounces of soda in each botle is given. At a 0.05, can we reject the claim that the machine is functioning properly? Use the P-value method. 12.1 12.08 12.01 11.99 11.94 11.97 11.99 11.93 O Since P-value > 0.05, reject the null hypothesis. There is enough evidence to reject the claim that the standard deviation is les than - equal to 0.03 ounce. O Since P-value <0.05, reject the null hypothesis. There is enough evidente to reject the claim that the standard deviation is less than equal to 0.03 ounce. O Since P-value> 0.05, do not reject the null hypothesis. There is not enough evidence to reject the claim that the standard deviation less than or equal to 0.03 ounce. O Since P-value<0.05, do not reject the null'hypothesis. There is not enough evidence to reject the claim that the standard deviation less than or equal to 0.03 ounce.

MATLAB: An Introduction with Applications
6th Edition
ISBN:9781119256830
Author:Amos Gilat
Publisher:Amos Gilat
Chapter1: Starting With Matlab
Section: Chapter Questions
Problem 1P

Related questions
Question
30
Transcribed Image Text:P-value <U.JU
O 0.1 <P-value <0.20
O0.025 <P-value <0.05
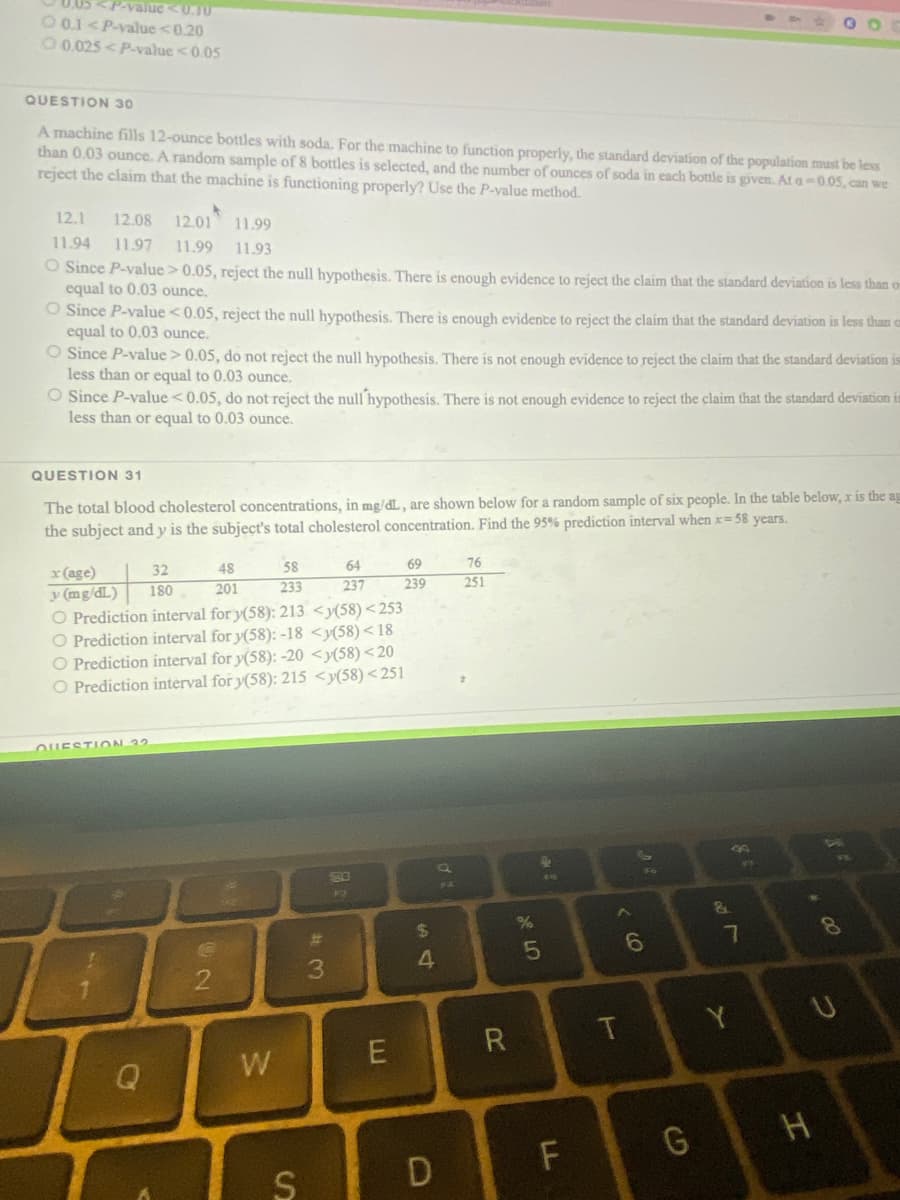
QUESTION 30
A machine fills 12-ounce botles with soda. For the machine to function properly, the standard deviation of the population must be less
than 0.03 ounce. A random sample of 8 bottles is selected, and the number of ounces of soda in each botle is given. At a-0.05, can we
reject the claim that the machine is functioning properly? Use thec P-value method.
12.1
12.08
12.01
11.99
11.94
11.97
11.99
11.93
O Since P-value > 0.05, reject the null hypothesis. There is enough evidence to reject the claim that the standard deviation is less than on
equal to 0.03 ounce.
O Since P-value <0.05, reject the null hypothesis. There is enough evidente to reject the claim that the standard deviation is less than o
equal to 0.03 ounce.
O Since P-value > 0.05, do not reject the null hypothesis. There is not enough evidence to reject the claim that the standard deviation is
less than or equal to 0.03 ounce.
O Since P-value <0.05, do not reject the null hypothesis. There is not enough evidence to reject the claim that the standard deviation is
less than or equal to 0.03 ounce.
QUESTION 31
The total blood cholesterol concentrations, in mg/dL, are shown below for a random sample of six people. In the table below, x is the ag
the subject and y is the subject's total cholesterol concentration. Find the 95% prediction interval when x= 58 years.
32
48
58
64
69
76
x(age)
y (mg/dL)
O Prediction interval for y(58): 213 <y(58)< 253
O Prediction interval for y(58): -18 <y(58)< 18
O Prediction interval for y(58): -20 <y(58)< 20
O Prediction intèrval for y(58): 215 <y(58) <251
180
201
233
237
239
251
OUESTION 32
E500
F3
%24
6.
Y U
R
W
S
エ
LL
Expert Solution
This question has been solved!
Explore an expertly crafted, step-by-step solution for a thorough understanding of key concepts.

This is a popular solution!

Trending now
This is a popular solution!

Step by step
Solved in 3 steps with 4 images

Recommended textbooks for you
MATLAB: An Introduction with Applications
Statistics
ISBN:
9781119256830
Author:
Amos Gilat
Publisher:
John Wiley & Sons Inc

Probability and Statistics for Engineering and th…
Statistics
ISBN:
9781305251809
Author:
Jay L. Devore
Publisher:
Cengage Learning

Statistics for The Behavioral Sciences (MindTap C…
Statistics
ISBN:
9781305504912
Author:
Frederick J Gravetter, Larry B. Wallnau
Publisher:
Cengage Learning
MATLAB: An Introduction with Applications
Statistics
ISBN:
9781119256830
Author:
Amos Gilat
Publisher:
John Wiley & Sons Inc
Probability and Statistics for Engineering and th…
Statistics
ISBN:
9781305251809
Author:
Jay L. Devore
Publisher:
Cengage Learning
Statistics for The Behavioral Sciences (MindTap C…
Statistics
ISBN:
9781305504912
Author:
Frederick J Gravetter, Larry B. Wallnau
Publisher:
Cengage Learning

Elementary Statistics: Picturing the World (7th E…
Statistics
ISBN:
9780134683416
Author:
Ron Larson, Betsy Farber
Publisher:
PEARSON

The Basic Practice of Statistics
Statistics
ISBN:
9781319042578
Author:
David S. Moore, William I. Notz, Michael A. Fligner
Publisher:
W. H. Freeman

Introduction to the Practice of Statistics
Statistics
ISBN:
9781319013387
Author:
David S. Moore, George P. McCabe, Bruce A. Craig
Publisher:
W. H. Freeman