A man surveyed a sample of 36 high school students and asked, "How many days in the past week have you consumed an alcoholic beverage?" The results of the survey are shown to the right. Use these results to answer parts (a) through (f). 1 1 4 1. 1 2 1 1 1 1 2 1 1 1 1 3 2 (a) Is this data discrete or continuous? O Continuous Discrete (b) Draw a histogram of the data and describe its shape. Choose the histogram below that correctly depicts the given data. O A. OB. Oc. OD. Q Q Q 20- 15- 10- 2어 15- 10- 20- 15- 10- 5- 20- 15- 10- 5- 5- 0- 012345 Number of Drinks ó 12 345 Number of Drinks ó 12345 012345 Number of Drinks Number of drinks Describe the shape of the distribution. Choose the correct answer below. O A. The distribution is symmetric. O B. The distribution is skewed left. OC. The distribution is skewed right. (c) Based on the shape of the histogram, do you expect the mean to be more than, equal to, or less than the median? O A. The mean should be roughly equal to the median. O B. The mean should be substantially larger than the median. Oc. The mean should be substantially smaller than the median.
A man surveyed a sample of 36 high school students and asked, "How many days in the past week have you consumed an alcoholic beverage?" The results of the survey are shown to the right. Use these results to answer parts (a) through (f). 1 1 4 1. 1 2 1 1 1 1 2 1 1 1 1 3 2 (a) Is this data discrete or continuous? O Continuous Discrete (b) Draw a histogram of the data and describe its shape. Choose the histogram below that correctly depicts the given data. O A. OB. Oc. OD. Q Q Q 20- 15- 10- 2어 15- 10- 20- 15- 10- 5- 20- 15- 10- 5- 5- 0- 012345 Number of Drinks ó 12 345 Number of Drinks ó 12345 012345 Number of Drinks Number of drinks Describe the shape of the distribution. Choose the correct answer below. O A. The distribution is symmetric. O B. The distribution is skewed left. OC. The distribution is skewed right. (c) Based on the shape of the histogram, do you expect the mean to be more than, equal to, or less than the median? O A. The mean should be roughly equal to the median. O B. The mean should be substantially larger than the median. Oc. The mean should be substantially smaller than the median.

Algebra & Trigonometry with Analytic Geometry
13th Edition
ISBN:9781133382119
Author:Swokowski
Publisher:Swokowski
Chapter7: Analytic Trigonometry
Section7.6: The Inverse Trigonometric Functions
Problem 91E

Related questions
Question
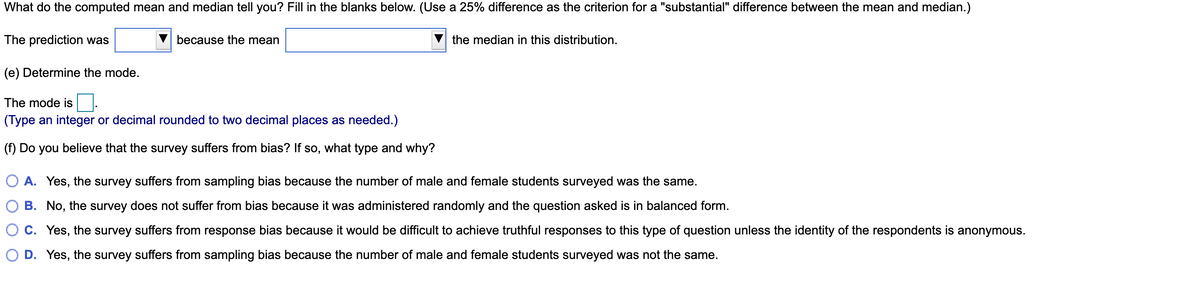
Transcribed Image Text:What do the computed mean and median tell you? Fill in the blanks below. (Use a 25% difference as the criterion for a "substantial" difference between the mean and median.)
The prediction was
because the mean
the median in this distribution.
(e) Determine the mode.
The mode is
(Type an integer or decimal rounded to two decimal places as needed.)
(f) Do you believe that the survey suffers from bias? If so, what type and why?
O A. Yes, the survey suffers from sampling bias because the number of male and female students surveyed was the same.
B. No, the survey does not suffer from bias because it was administered randomly and the question asked is in balanced form.
O C. Yes, the survey suffers from response bias because it would be difficult to achieve truthful responses to this type of question unless the identity of the respondents is anonymous.
O D. Yes, the survey suffers from sampling bias because the number of male and female students surveyed was not the same.
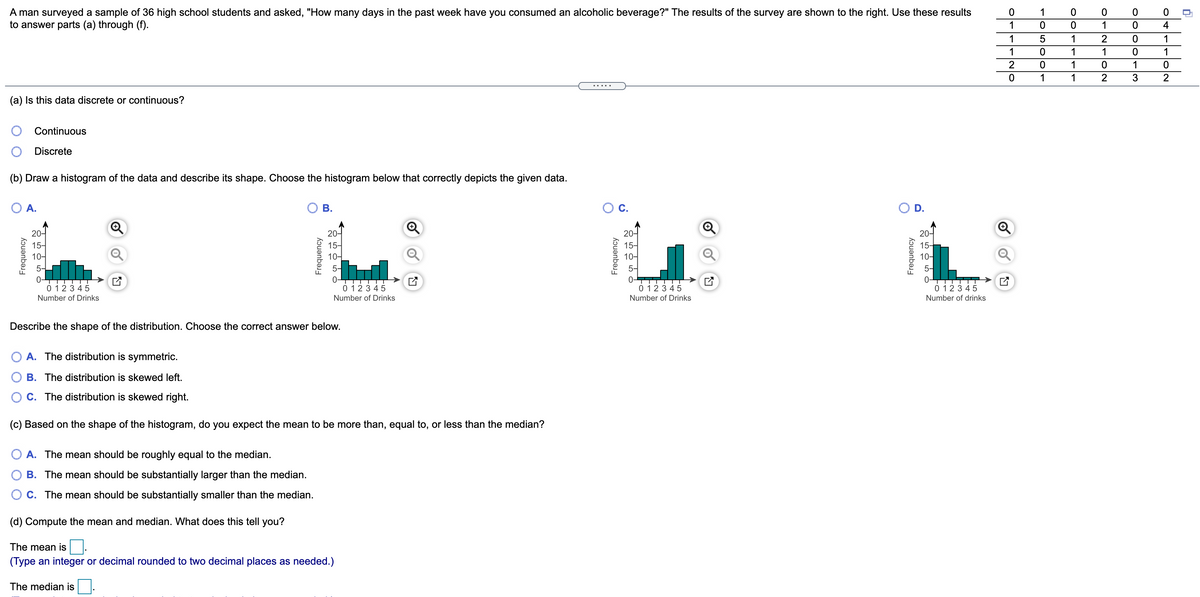
Transcribed Image Text:A man surveyed a sample of 36 high school students and asked, "How many days in the past week have you consumed an alcoholic beverage?" The results of the survey are shown to the right. Use these results
to answer parts (a) through (f).
1
1
1
4
1
1
2
1
1
1
1
1
1
1
1
2
.....
(a) Is this data discrete or continuous?
Continuous
Discrete
(b) Draw a histogram of the data and describe its shape. Choose the histogram below that correctly depicts the given data.
O A.
В.
C.
O D.
20-
20-
15-
20-
15-
10-
20-
15-
10-
15-
10-
10-
5-
5-
5-
TTTT
0-
TTT
0 123 45
0 123 45
0 123 45
0 123 45
Number of Drinks
Number of Drinks
Number of Drinks
Number of drinks
Describe the shape of the distribution. Choose the correct answer below.
O A. The distribution is symmetric.
O B. The distribution is skewed left.
O C. The distribution is skewed right.
(c) Based on the shape of the histogram, do you expect the mean to be more than, equal to, or less than the median?
O A. The mean should be roughly equal to the median.
B. The mean should be substantially larger than the median.
O c. The mean should be substantially smaller than the median.
(d) Compute the mean and median. What does this tell you?
The mean is
(Type an integer or decimal rounded to two decimal places as needed.)
The median is
Frequency
Frequency
Frequency
Frequency
olc
Expert Solution
This question has been solved!
Explore an expertly crafted, step-by-step solution for a thorough understanding of key concepts.

This is a popular solution!

Trending now
This is a popular solution!

Step by step
Solved in 2 steps

Recommended textbooks for you
Algebra & Trigonometry with Analytic Geometry
Algebra
ISBN:
9781133382119
Author:
Swokowski
Publisher:
Cengage


Trigonometry (MindTap Course List)
Trigonometry
ISBN:
9781337278461
Author:
Ron Larson
Publisher:
Cengage Learning
Algebra & Trigonometry with Analytic Geometry
Algebra
ISBN:
9781133382119
Author:
Swokowski
Publisher:
Cengage
Trigonometry (MindTap Course List)
Trigonometry
ISBN:
9781337278461
Author:
Ron Larson
Publisher:
Cengage Learning

Big Ideas Math A Bridge To Success Algebra 1: Stu…
Algebra
ISBN:
9781680331141
Author:
HOUGHTON MIFFLIN HARCOURT
Publisher:
Houghton Mifflin Harcourt

Glencoe Algebra 1, Student Edition, 9780079039897…
Algebra
ISBN:
9780079039897
Author:
Carter
Publisher:
McGraw Hill