The data to the right represent the number of customers waiting for a table at 6:00 P.M. for 40 consecutive Saturdays at Bobak's Restaurant. Complete parts (a) through (h) below. 10 12 9. 13 7 15 14 9. 11 7 11 12 12 10 8 9. 8 11 14 13 12 8 10 8 10 12 11 11 10 10 11 8 ..... (a) Are these data discrete or continuous? Explain. A. The data are discrete because there are a finite or countable number of values. B. The data are continuous because there are a finite or countable number of values. C. The data are continuous because it was recorded for 40 consecutive Saturdays. D. The data are discrete because it was recorded for 40 consecutive Saturdays. (b) Construct a frequency distribution of the data. Number of Frequency Customers 1-3 4-6 7-9 10–12 13-15 (c) Construct a relative frequency distribution of the data. Number of Relative Customers Frequency
The data to the right represent the number of customers waiting for a table at 6:00 P.M. for 40 consecutive Saturdays at Bobak's Restaurant. Complete parts (a) through (h) below. 10 12 9. 13 7 15 14 9. 11 7 11 12 12 10 8 9. 8 11 14 13 12 8 10 8 10 12 11 11 10 10 11 8 ..... (a) Are these data discrete or continuous? Explain. A. The data are discrete because there are a finite or countable number of values. B. The data are continuous because there are a finite or countable number of values. C. The data are continuous because it was recorded for 40 consecutive Saturdays. D. The data are discrete because it was recorded for 40 consecutive Saturdays. (b) Construct a frequency distribution of the data. Number of Frequency Customers 1-3 4-6 7-9 10–12 13-15 (c) Construct a relative frequency distribution of the data. Number of Relative Customers Frequency

Chapter5: Exponential And Logarithmic Functions
Section5.5: Exponential And Logarithmic Models
Problem 4ECP

Related questions
Question
Transcribed Image Text:The data to the right represent the number of
10
12
5
13
7
....
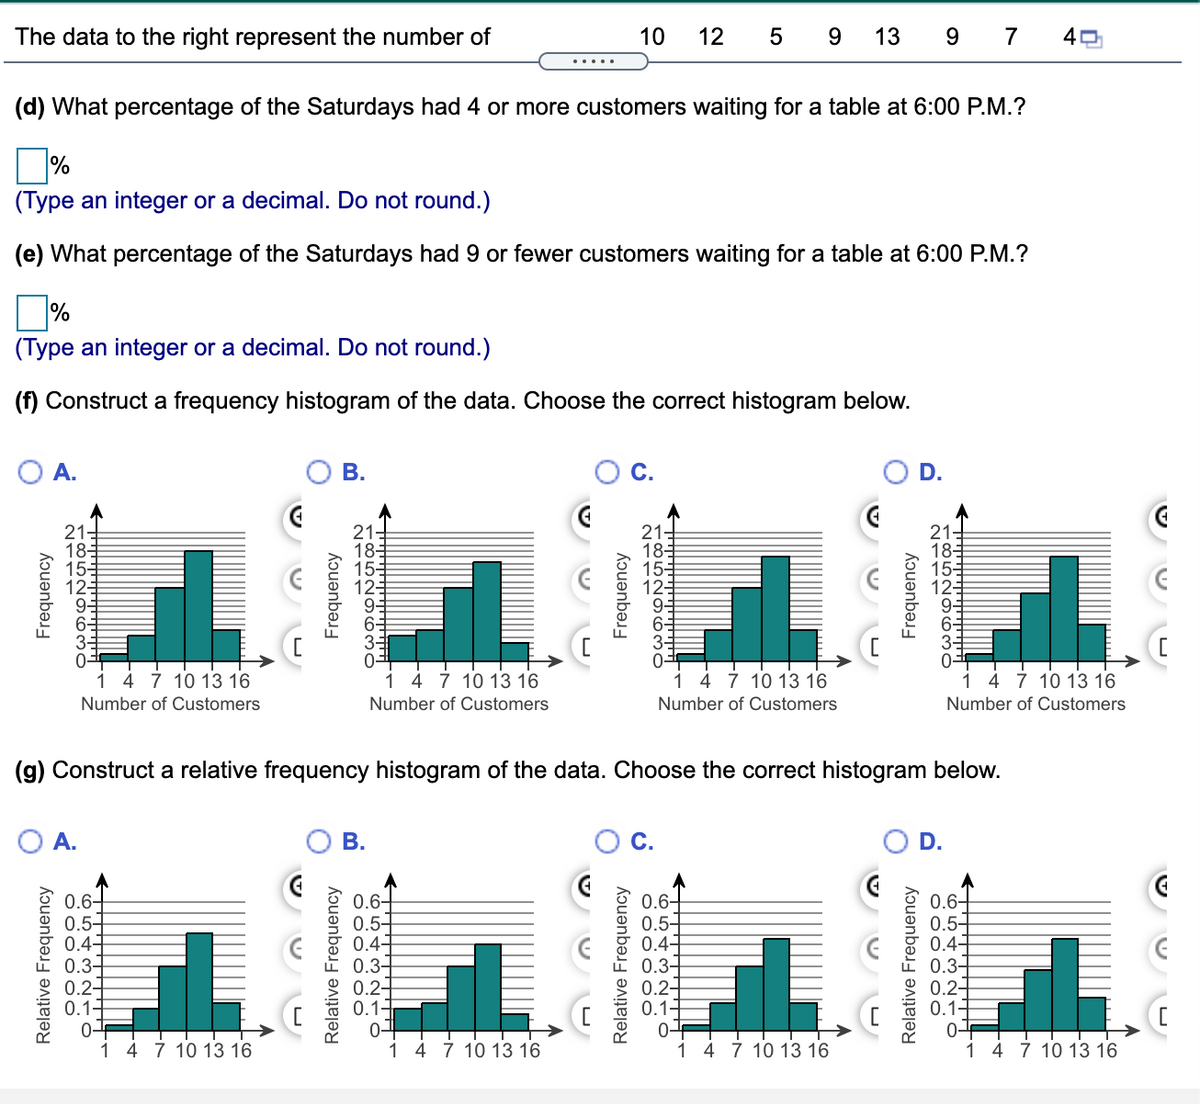
(d) What percentage of the Saturdays had 4 or more customers waiting for a table at 6:00 P.M.?
(Type an integer or a decimal. Do not round.)
(e) What percentage of the Saturdays had 9 or fewer customers waiting for a table at 6:00 P.M.?
(Type an integer or a decimal. Do not round.)
(f) Construct a frequency histogram of the data. Choose the correct histogram below.
A.
В.
С.
D.
21-
18=
155
12
21-
181
153
12
21-
185
153
123
21-
18-
15-
12-
4 7 10 13 16
4 7 10 13 16
1 4 7 10 13 16
1 4 7 10 13 16
Number of Customers
Number of Customers
Number of Customers
Number of Customers
(g) Construct a relative frequency histogram of the data. Choose the correct histogram below.
A.
В.
D.
0.6-
0.5-
0.4-
0.3-
0.2-
0.11
0-F
1 4 7 10 13 16
0.6-
0.5-
0.4-
0.3-
0.2-
0.11
0.6+
0.5-
0.4-
0.3-
0.2-
0.11
0.6-
0.5-
0.4-
0.3-
0.2-
0.14
1 4 7 10 13 16
1 4 7 10 13 16
1 4 7 10 13 16
Frequency
Relative Frequency
Relative Frequency
Frequency
Frequency
Relative Frequency
Relative Frequency
Frequency
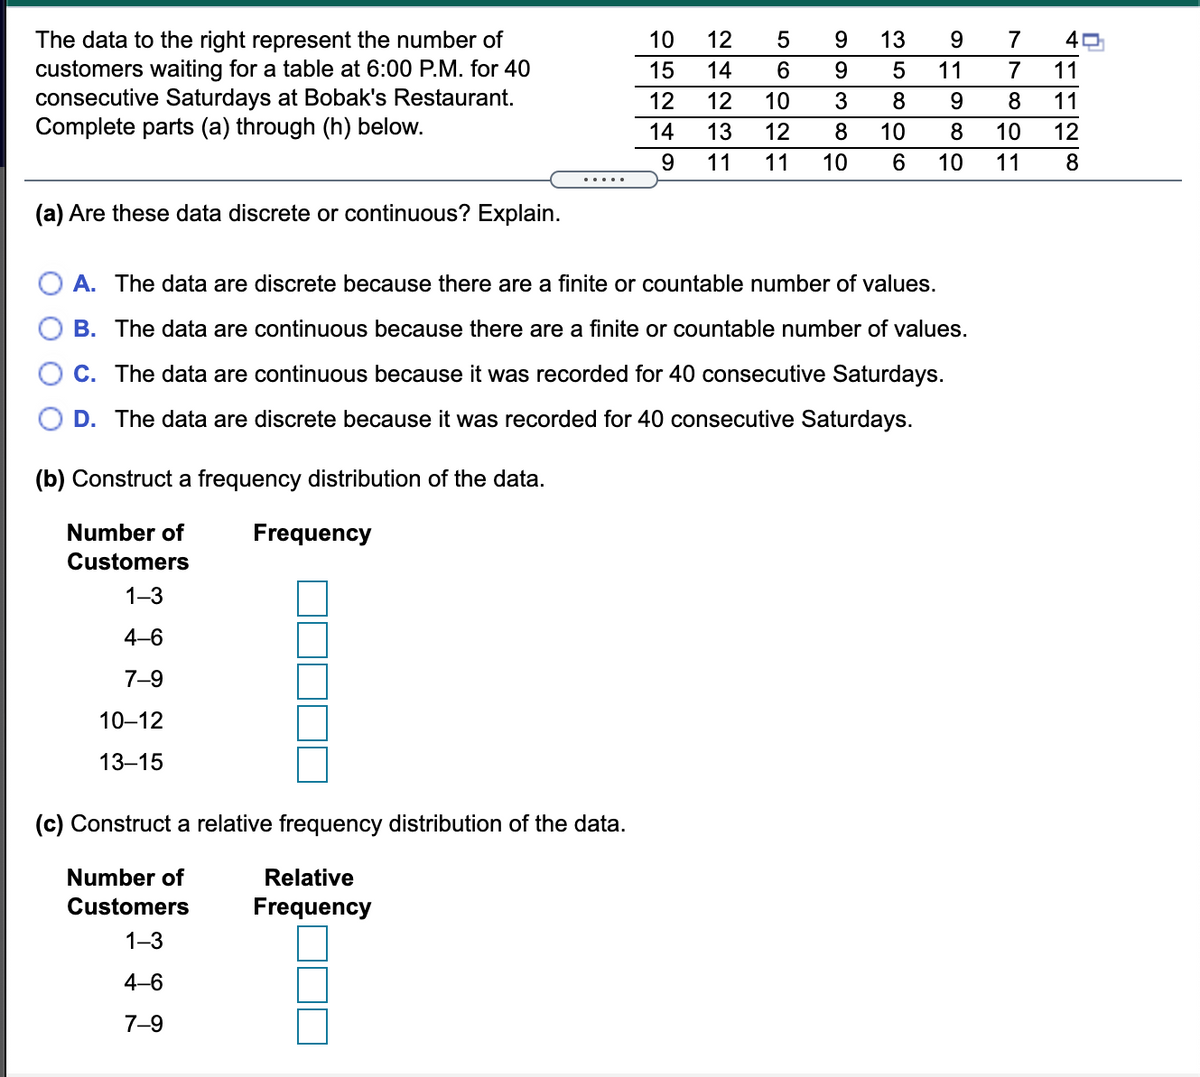
Transcribed Image Text:The data to the right represent the number of
customers waiting for a table at 6:00 P.M. for 40
consecutive Saturdays at Bobak's Restaurant.
Complete parts (a) through (h) below.
10
12
5
13
9.
7
15
14
9.
11
7
11
12
12
10
8.
9.
8
11
14
13
12
8
10
8
10
12
9.
11
11
10
6
10
11
(a) Are these data discrete or continuous? Explain.
A. The data are discrete because there are a finite or countable number of values.
B. The data are continuous because there are a finite or countable number of values.
C. The data are continuous because it was recorded for 40 consecutive Saturdays.
D. The data are discrete because it was recorded for 40 consecutive Saturdays.
(b) Construct a frequency distribution of the data.
Number of
Frequency
Customers
1-3
4-6
7-9
10–12
13–15
(c) Construct a relative frequency distribution of the data.
Number of
Relative
Customers
Frequency
1-3
4-6
7-9
Expert Solution
This question has been solved!
Explore an expertly crafted, step-by-step solution for a thorough understanding of key concepts.

This is a popular solution!

Trending now
This is a popular solution!

Step by step
Solved in 2 steps with 2 images

Recommended textbooks for you

Trigonometry (MindTap Course List)
Trigonometry
ISBN:
9781337278461
Author:
Ron Larson
Publisher:
Cengage Learning

Glencoe Algebra 1, Student Edition, 9780079039897…
Algebra
ISBN:
9780079039897
Author:
Carter
Publisher:
McGraw Hill
Trigonometry (MindTap Course List)
Trigonometry
ISBN:
9781337278461
Author:
Ron Larson
Publisher:
Cengage Learning
Glencoe Algebra 1, Student Edition, 9780079039897…
Algebra
ISBN:
9780079039897
Author:
Carter
Publisher:
McGraw Hill