A man surveyed a sample of 36 high school students and asked, "How many days in the past week have you consumed an alcoholic beverage The results of the survey are shown to the right. Use these results to answer parts (a) through . 2 Question 3: (a) la tis data dscrete or contrsous? O Discrete O Cortiruoun ®) Draw a histogram of he data and describe is shape. Choose the histogram below tat comecty depicts the given data O. 612546 Nuber 612545 Nuberf Nuer of D Numter D Describe the shape of the distribution. Choose the comect answer below. OA The distribution is skewed left. OB. The distribution is skewed right. O. The distribution is symmetric. (e) Based on the shape of the histogram, do you expect the mean to be more than, equal to, or less than the median? OA The mean should be substantialy smaller than the median. OB. The mean should be substantialy larger than the median. OC. The mean should be roughly equal to the median. (4) Compute the mean and median. What does this tell you? The mean isO (Type an integer or decimal rounded to two decimal places as needed.) The medan is (Type an integer or decimal rounded to two decimal places as needed.) What do the computed mean and median tell you Fin the blanks below. (Use a 25% aference as the oriterion for a substantiar diference between the mean and median) because the mean The prediction was e median in tis datrbuton. (0) Determine the mode. The mode isO (Type an integer or decimal rounded to two decimal places as needed.) M Do you believe that the survey sufers from bias? If so, what type and why? OA Yes, the survey sufers from sampling bias because the number of male and female students surveyed was not the same OB. Yes, the survey suffers from sampling bias because the number of male and female students surveyed was the same. OC. No, the survey does not suffer from bias because it was administered randomly and the question asked is in balanced form. OD. Yes, he survey suffers from response bias because it would be dificut to achieve truetl responses to this type of question unless the identity of the respondents is anonymous
A man surveyed a sample of 36 high school students and asked, "How many days in the past week have you consumed an alcoholic beverage The results of the survey are shown to the right. Use these results to answer parts (a) through . 2 Question 3: (a) la tis data dscrete or contrsous? O Discrete O Cortiruoun ®) Draw a histogram of he data and describe is shape. Choose the histogram below tat comecty depicts the given data O. 612546 Nuber 612545 Nuberf Nuer of D Numter D Describe the shape of the distribution. Choose the comect answer below. OA The distribution is skewed left. OB. The distribution is skewed right. O. The distribution is symmetric. (e) Based on the shape of the histogram, do you expect the mean to be more than, equal to, or less than the median? OA The mean should be substantialy smaller than the median. OB. The mean should be substantialy larger than the median. OC. The mean should be roughly equal to the median. (4) Compute the mean and median. What does this tell you? The mean isO (Type an integer or decimal rounded to two decimal places as needed.) The medan is (Type an integer or decimal rounded to two decimal places as needed.) What do the computed mean and median tell you Fin the blanks below. (Use a 25% aference as the oriterion for a substantiar diference between the mean and median) because the mean The prediction was e median in tis datrbuton. (0) Determine the mode. The mode isO (Type an integer or decimal rounded to two decimal places as needed.) M Do you believe that the survey sufers from bias? If so, what type and why? OA Yes, the survey sufers from sampling bias because the number of male and female students surveyed was not the same OB. Yes, the survey suffers from sampling bias because the number of male and female students surveyed was the same. OC. No, the survey does not suffer from bias because it was administered randomly and the question asked is in balanced form. OD. Yes, he survey suffers from response bias because it would be dificut to achieve truetl responses to this type of question unless the identity of the respondents is anonymous

Chapter5: Exponential And Logarithmic Functions
Section5.5: Exponential And Logarithmic Models
Problem 4ECP

Related questions
Question
PARTS D, E, and F....ALREADY COMPLETED A, B, and C
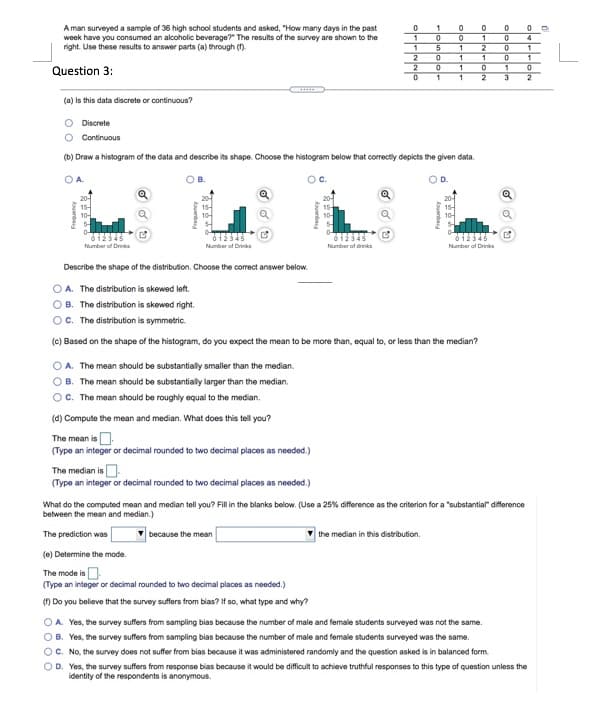
Transcribed Image Text:A man surveyed a sample of 36 high school students and asked, "How many days in the past
week have you consumed an alcoholic beverage?" The results of the survey are shown to the
right. Use these results to answer parts (a) through ().
4.
1
1
Question 3:
1
3
(a) Is this data discrete or continuous?
Discrete
O Continuous
(b) Draw a histogram of the data and describe its shape. Choose the histogram below that correctly depicts the given data.
OA.
OB.
Oc.
OD.
20-
15-
10-
15-
10-
Number of Drika
Number of Drinks
Number of Drinka
Number of drinka
Describe the shape of the distribution. Choose the correct answer below.
O A. The distribution is skewed left.
O B. The distribution is skewed right.
OC. The distribution is symmetric.
(c) Based on the shape of the histogram, do you expect the mean to be more than, equal to, or less than the median?
A. The mean should be substantially smaller than the median.
B. The mean should be substantially larger than the median.
OC. The mean should be roughly equal to the median.
(d) Compute the mean and median. What does this tell you?
The mean is.
(Type an integer or decimal rounded to two decimal places as needed.)
The median is O.
(Type an integer or decimal rounded to two decimal places as needed.)
What do the computed mean and median tell you? Fill in the blanks below. (Use a 25% difference as the criterion for a "substantia" difference
between the mean and median.)
The prediction was
the median in this distribution.
because the mean
(e) Determine the mode.
The mode is O
(Type an integer or decimal rounded to two decimal places as needed.)
() Do you believe that the survey suffers from bias? If so, what type and why?
O A. Yes, the survey suffers from sampling bias because the number of male and female students surveyed was not the same.
O B. Yes, the survey suffers from sampling bias because the number of male and female students surveyed was the same.
OC. No, the survey does not suffer from bias because it was administered randomly and the question asked is in balanced form.
OD. Yes, the survey suffers from response bias because it would be difficult to achieve truthful responses to this type of question unless the
identity of the respondents is anonymous.
Averbg
Aouenba
Expert Solution
This question has been solved!
Explore an expertly crafted, step-by-step solution for a thorough understanding of key concepts.

This is a popular solution!

Trending now
This is a popular solution!

Step by step
Solved in 2 steps with 2 images

Recommended textbooks for you

Trigonometry (MindTap Course List)
Trigonometry
ISBN:
9781337278461
Author:
Ron Larson
Publisher:
Cengage Learning

Holt Mcdougal Larson Pre-algebra: Student Edition…
Algebra
ISBN:
9780547587776
Author:
HOLT MCDOUGAL
Publisher:
HOLT MCDOUGAL
Trigonometry (MindTap Course List)
Trigonometry
ISBN:
9781337278461
Author:
Ron Larson
Publisher:
Cengage Learning
Holt Mcdougal Larson Pre-algebra: Student Edition…
Algebra
ISBN:
9780547587776
Author:
HOLT MCDOUGAL
Publisher:
HOLT MCDOUGAL

Glencoe Algebra 1, Student Edition, 9780079039897…
Algebra
ISBN:
9780079039897
Author:
Carter
Publisher:
McGraw Hill

Algebra & Trigonometry with Analytic Geometry
Algebra
ISBN:
9781133382119
Author:
Swokowski
Publisher:
Cengage

Functions and Change: A Modeling Approach to Coll…
Algebra
ISBN:
9781337111348
Author:
Bruce Crauder, Benny Evans, Alan Noell
Publisher:
Cengage Learning