A manager at a farm is curious about if the size of the Colossal Cantaloupe melons that they grow at the farm has increased. They know that last year, the average weight of the Colossal Cantaloupes that were grown on the farm was 37 pounds. They take a sample of 29 melons and with a mean of 38.4 pounds and a sample standard deviation of 5.1 pounds. Has the weight of the melons increased since last year? Let u be the true mean weight of the Colossal Cantaloupes grown this year at the farm. Test this claim at the a= 0.05 level. (a) Set up the null and alternative hypothesis (using mathematical notation/numbers AND interpret them in context of the problem). (b) Calculate the test statistic. (c) Calculate the critical value. (d) Draw a picture of the distribution of the test statistic under Ho. Label and provide values for the critical value and the test statistic, and shade the critical region. (e) Make and justify a statistical decision at the a = 0.05 level and state your conclusion.
A manager at a farm is curious about if the size of the Colossal Cantaloupe melons that they grow at the farm has increased. They know that last year, the average weight of the Colossal Cantaloupes that were grown on the farm was 37 pounds. They take a sample of 29 melons and with a mean of 38.4 pounds and a sample standard deviation of 5.1 pounds. Has the weight of the melons increased since last year? Let u be the true mean weight of the Colossal Cantaloupes grown this year at the farm. Test this claim at the a= 0.05 level. (a) Set up the null and alternative hypothesis (using mathematical notation/numbers AND interpret them in context of the problem). (b) Calculate the test statistic. (c) Calculate the critical value. (d) Draw a picture of the distribution of the test statistic under Ho. Label and provide values for the critical value and the test statistic, and shade the critical region. (e) Make and justify a statistical decision at the a = 0.05 level and state your conclusion.

Glencoe Algebra 1, Student Edition, 9780079039897, 0079039898, 2018
18th Edition
ISBN:9780079039897
Author:Carter
Publisher:Carter
Chapter10: Statistics
Section10.4: Distributions Of Data
Problem 19PFA

Related questions
Question
100%
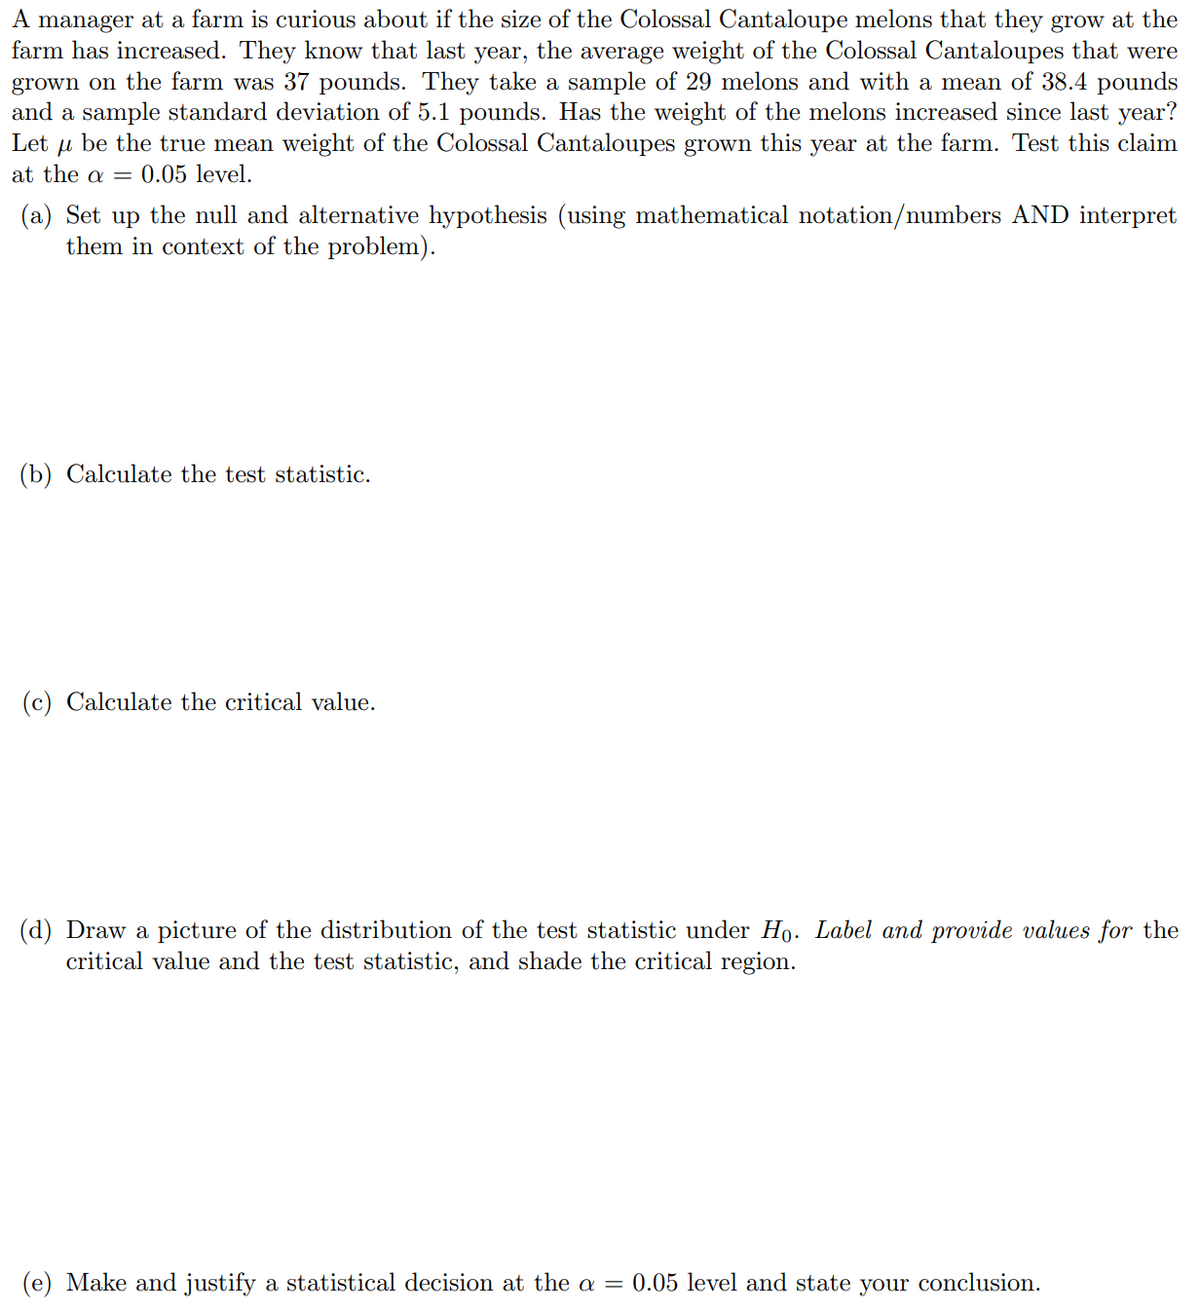
Transcribed Image Text:A manager at a farm is curious about if the size of the Colossal Cantaloupe melons that they grow at the
farm has increased. They know that last year, the average weight of the Colossal Cantaloupes that were
grown on the farm was 37 pounds. They take a sample of 29 melons and with a mean of 38.4 pounds
and a sample standard deviation of 5.1 pounds. Has the weight of the melons increased since last year?
Let u be the true mean weight of the Colossal Cantaloupes grown this year at the farm. Test this claim
at the a= 0.05 level.
(a) Set up the null and alternative hypothesis (using mathematical notation/numbers AND interpret
them in context of the problem).
(b) Calculate the test statistic.
(c) Calculate the critical value.
(d) Draw a picture of the distribution of the test statistic under Ho. Label and provide values for the
critical value and the test statistic, and shade the critical region.
(e) Make and justify a statistical decision at the a = 0.05 level and state your conclusion.
Expert Solution
This question has been solved!
Explore an expertly crafted, step-by-step solution for a thorough understanding of key concepts.

Step by step
Solved in 2 steps with 1 images

Recommended textbooks for you
Glencoe Algebra 1, Student Edition, 9780079039897…
Algebra
ISBN:
9780079039897
Author:
Carter
Publisher:
McGraw Hill
Glencoe Algebra 1, Student Edition, 9780079039897…
Algebra
ISBN:
9780079039897
Author:
Carter
Publisher:
McGraw Hill