1. Determine the LSRL equation using the format y-mx+b. 2. Describe the slope (m) and its meaning in the context of the data [particularly as it relates to the y-variable]. 3. Use the LSRL you wrote to predict how much of a tip Brianna should expect for a $150.00 order. Does that tip match up with her other tips? Why or why not? 4. Determine the residual for the $102.21 order using the Residual Table. What does this residual tell you about the tip this customer left for Brianna?
1. Determine the LSRL equation using the format y-mx+b. 2. Describe the slope (m) and its meaning in the context of the data [particularly as it relates to the y-variable]. 3. Use the LSRL you wrote to predict how much of a tip Brianna should expect for a $150.00 order. Does that tip match up with her other tips? Why or why not? 4. Determine the residual for the $102.21 order using the Residual Table. What does this residual tell you about the tip this customer left for Brianna?

Glencoe Algebra 1, Student Edition, 9780079039897, 0079039898, 2018
18th Edition
ISBN:9780079039897
Author:Carter
Publisher:Carter
Chapter4: Equations Of Linear Functions
Section4.5: Correlation And Causation
Problem 21PFA

Related questions
Question
I need help. ASAP
![Clever | Portal
0.0052 -5.5135 0.0006
Adj. R-Sq= 0.7656 r=-0.8898
●
-2
50
100 150 200 250 300
Order Amount $
1. Determine the LSRL equation using the format y-mx+b.
2. Describe the slope (m) and its meaning in the context of the data [particularly as it relates to the y-variable].
3. Use the LSRL you wrote to predict how much of a tip Brianna should expect for a $150.00 order. Does that tip match up with her other
tips? Why or why not?
4. Determine the residual for the $102.21 order using the Residual Table. What does this residual tell you about the tip this customer left
for Brianna?
5. Using the Residual Plot, is a linear model the most appropriate for this data? Why or why not?
Number EACH of your answers to the above 5 questions so you don't forget to answer any of them!!!
Residual Plot
2
Residual
1
O
101.2
●
●
Order Amount S
S = 1.275
-0.0289
R-Sq=0.7917](/v2/_next/image?url=https%3A%2F%2Fcontent.bartleby.com%2Fqna-images%2Fquestion%2F6b8611bf-ee22-4e76-86e5-f16e6b5c586b%2F7092fb84-e582-43eb-9587-076241f59353%2Fmsj68fc_processed.jpeg&w=3840&q=75)
Transcribed Image Text:Clever | Portal
0.0052 -5.5135 0.0006
Adj. R-Sq= 0.7656 r=-0.8898
●
-2
50
100 150 200 250 300
Order Amount $
1. Determine the LSRL equation using the format y-mx+b.
2. Describe the slope (m) and its meaning in the context of the data [particularly as it relates to the y-variable].
3. Use the LSRL you wrote to predict how much of a tip Brianna should expect for a $150.00 order. Does that tip match up with her other
tips? Why or why not?
4. Determine the residual for the $102.21 order using the Residual Table. What does this residual tell you about the tip this customer left
for Brianna?
5. Using the Residual Plot, is a linear model the most appropriate for this data? Why or why not?
Number EACH of your answers to the above 5 questions so you don't forget to answer any of them!!!
Residual Plot
2
Residual
1
O
101.2
●
●
Order Amount S
S = 1.275
-0.0289
R-Sq=0.7917
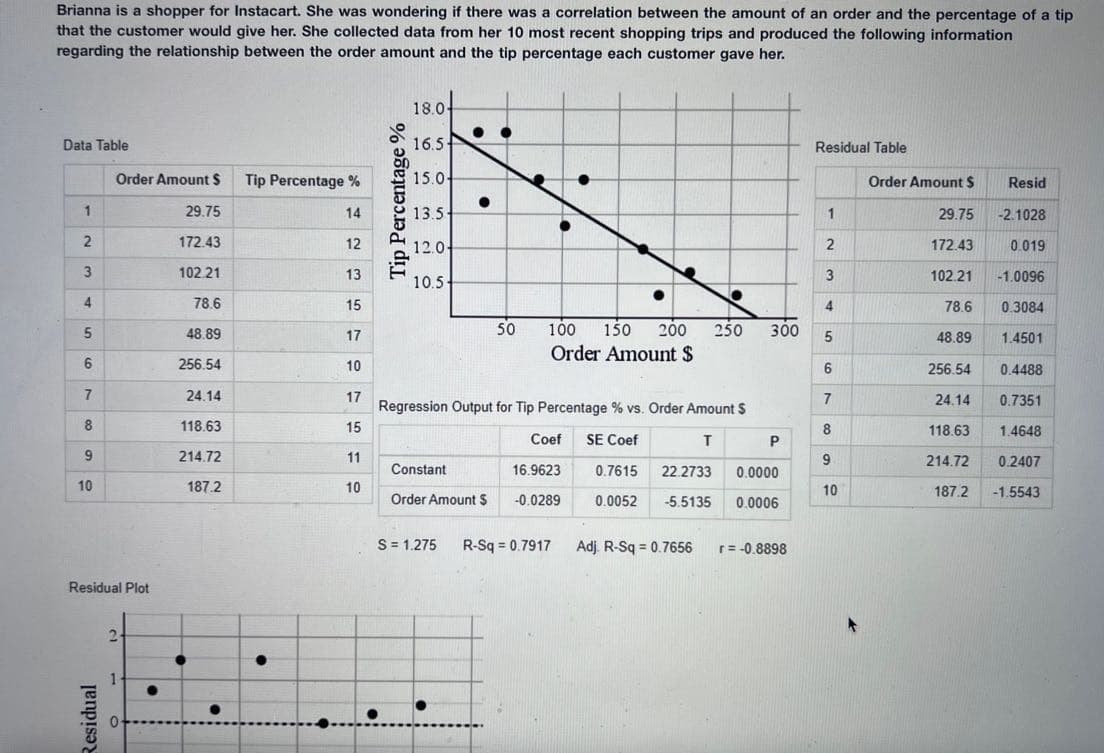
Transcribed Image Text:Brianna is a shopper for Instacart. She was wondering if there was a correlation between the amount of an order and the percentage of a tip
that the customer would give her. She collected data from her 10 most recent shopping trips and produced the following information
regarding the relationship between the order amount and the tip percentage each customer gave her.
18.0
Data Table
16.5-
Residual Table
Order Amount $
Tip Percentage %
15.0
Order Amount $
Resid
-2.1028
1
29.75
14
13.5
1
29.75
2
172.43
12
2
172.43
0.019
12.0
3
102.21
13
3
102.21
-1.0096
10.5
4
78.6
15
4
0.3084
78.6
48.89
5
48.89
17
250 300 5
1.4501
50 100
150 200
Order Amount $
6
256.54
10
6
256.54
0.4488
7
24.14
17
7
24.14
0.7351
Regression Output for Tip Percentage % vs. Order Amount S
8
118.63
15
8
118.63
1.4648
T
P
9
214.72
11
9
214.72
0.2407
Constant
Coef
16.9623
-0.0289
SE Coef
0.7615 22.2733 0.0000
0.0052 -5.5135 0.0006
10
187.2
10
10
187.2
-1.5543
Order Amount $
S = 1.275 R-Sq=0.7917
Adj. R-Sq = 0.7656
r = -0.8898
Residual Plot
2
Residual
●
Tip Percentage %
●
6
Expert Solution
This question has been solved!
Explore an expertly crafted, step-by-step solution for a thorough understanding of key concepts.

This is a popular solution!

Trending now
This is a popular solution!

Step by step
Solved in 4 steps

Recommended textbooks for you
Glencoe Algebra 1, Student Edition, 9780079039897…
Algebra
ISBN:
9780079039897
Author:
Carter
Publisher:
McGraw Hill

Big Ideas Math A Bridge To Success Algebra 1: Stu…
Algebra
ISBN:
9781680331141
Author:
HOUGHTON MIFFLIN HARCOURT
Publisher:
Houghton Mifflin Harcourt
Glencoe Algebra 1, Student Edition, 9780079039897…
Algebra
ISBN:
9780079039897
Author:
Carter
Publisher:
McGraw Hill
Big Ideas Math A Bridge To Success Algebra 1: Stu…
Algebra
ISBN:
9781680331141
Author:
HOUGHTON MIFFLIN HARCOURT
Publisher:
Houghton Mifflin Harcourt