A manufacturer of colored candies states that 13% of the candies in a bag should be brown, 14% yelow, 13% red, 24% blue, 20% orange, and 16% green. A student randomly selected a bag of colored candies. He counted the number of candies of each color and obtained the results shown in the table. Test whether the baa of colored çandies follows the distribution stated above at the a = 0.05 level of sianificance. A. H, The distribution of colors is the same as stated by the manufacturer. H,: The distribution of colors is not the same as stated by the manufacturer. O B. Ho The distribution of colors is not the same as stated by the manufacturer. H, The distribution of colors is the same as stated by the manufacturer. - X O C. None of these. Observed distribution of colors Compute the expected counts for each color. Frequency Colored Candies in a bag Red Color Expected Count Color Frequency Claimed Proportion Brown 60 50.83 Brown Yellow Blue Orange Green 60 67 55 62 84 63 Yellow 67 54.74 0.13 0.14 0.13 0.24 0.20 0.16 Red 55 50.83 Blue 62 93.84 Orange 84 78.2 Green 63 62.56 Print Done (Round to two decimal places as needed.) What is the test statistic? x3 = 0 (Round to three decimal places as needed.)
A manufacturer of colored candies states that 13% of the candies in a bag should be brown, 14% yelow, 13% red, 24% blue, 20% orange, and 16% green. A student randomly selected a bag of colored candies. He counted the number of candies of each color and obtained the results shown in the table. Test whether the baa of colored çandies follows the distribution stated above at the a = 0.05 level of sianificance. A. H, The distribution of colors is the same as stated by the manufacturer. H,: The distribution of colors is not the same as stated by the manufacturer. O B. Ho The distribution of colors is not the same as stated by the manufacturer. H, The distribution of colors is the same as stated by the manufacturer. - X O C. None of these. Observed distribution of colors Compute the expected counts for each color. Frequency Colored Candies in a bag Red Color Expected Count Color Frequency Claimed Proportion Brown 60 50.83 Brown Yellow Blue Orange Green 60 67 55 62 84 63 Yellow 67 54.74 0.13 0.14 0.13 0.24 0.20 0.16 Red 55 50.83 Blue 62 93.84 Orange 84 78.2 Green 63 62.56 Print Done (Round to two decimal places as needed.) What is the test statistic? x3 = 0 (Round to three decimal places as needed.)

Holt Mcdougal Larson Pre-algebra: Student Edition 2012
1st Edition
ISBN:9780547587776
Author:HOLT MCDOUGAL
Publisher:HOLT MCDOUGAL
Chapter11: Data Analysis And Probability
Section: Chapter Questions
Problem 8CR

Related questions
Question
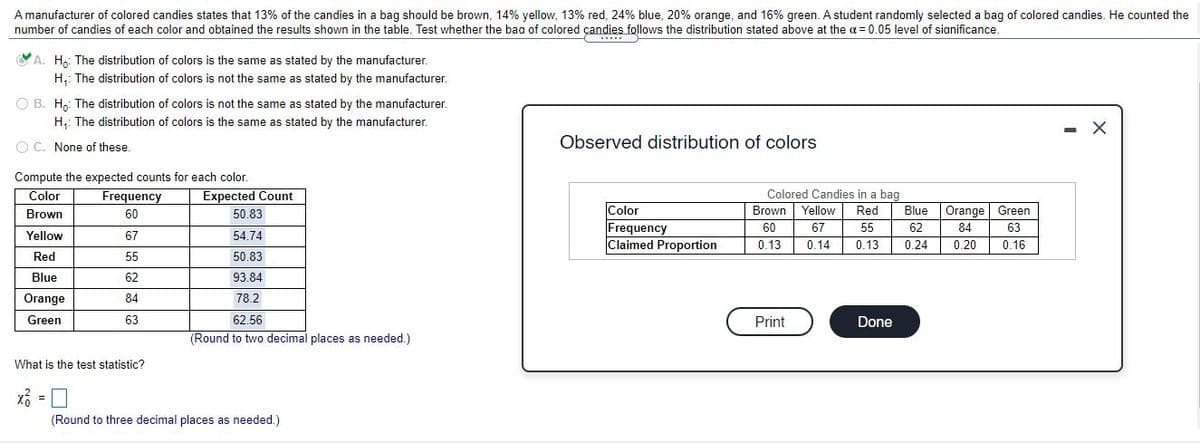
Transcribed Image Text:A manufacturer of colored candies states that 13% of the candies in a bag should be brown, 14% yellow, 13% red, 24% blue, 20% orange, and 16% green. A student randomly selected a bag of colored candies. He counted the
number of candies of each color and obtained the results shown in the table. Test whether the baa of colored çandies follows the distribution stated above at the a = 0.05 level of sianificance.
YA. H,: The distribution of colors is the same as stated by the manufacturer.
H,: The distribution of colors is not the same as stated by the manufacturer.
O B. H,: The distribution of colors is not the same as stated by the manufacturer.
H,: The distribution of colors is the same as stated by the manufacturer.
- X
O C. None of these.
Observed distribution of colors
Compute the expected counts for each color.
Frequency
Color
Expected Count
Colored Candies in a bag
Color
Frequency
Claimed Proportion
Brown
60
50.83
Brown Yellow
Red
Blue
Orange
Green
60
67
55
62
84
63
Yellow
67
54.74
0.13
0.14
0.13
0.24
0.20
0.16
Red
55
50.83
Blue
62
93.84
Orange
84
78.2
Green
63
62.56
Print
Done
(Round to two decimal places as needed.)
What is the test statistic?
(Round to three decimal places as needed.)
Expert Solution
This question has been solved!
Explore an expertly crafted, step-by-step solution for a thorough understanding of key concepts.

This is a popular solution!

Trending now
This is a popular solution!

Step by step
Solved in 3 steps

Recommended textbooks for you
Holt Mcdougal Larson Pre-algebra: Student Edition…
Algebra
ISBN:
9780547587776
Author:
HOLT MCDOUGAL
Publisher:
HOLT MCDOUGAL
Holt Mcdougal Larson Pre-algebra: Student Edition…
Algebra
ISBN:
9780547587776
Author:
HOLT MCDOUGAL
Publisher:
HOLT MCDOUGAL