A manufacturer uses a new production method to produce steel rods. A random sample of 27 steel rods resulted in lengths with a standard deviation of 3.89 cm. At the 0.01 significance level, using the p-value method, test the claim that the new production method has lengths with a standard deviation different from 3.61 cm, which was the standard deviation for the old method.
A manufacturer uses a new production method to produce steel rods. A random sample of 27 steel rods resulted in lengths with a standard deviation of 3.89 cm. At the 0.01 significance level, using the p-value method, test the claim that the new production method has lengths with a standard deviation different from 3.61 cm, which was the standard deviation for the old method.

MATLAB: An Introduction with Applications
6th Edition
ISBN:9781119256830
Author:Amos Gilat
Publisher:Amos Gilat
Chapter1: Starting With Matlab
Section: Chapter Questions
Problem 1P

Related questions
Topic Video
Question
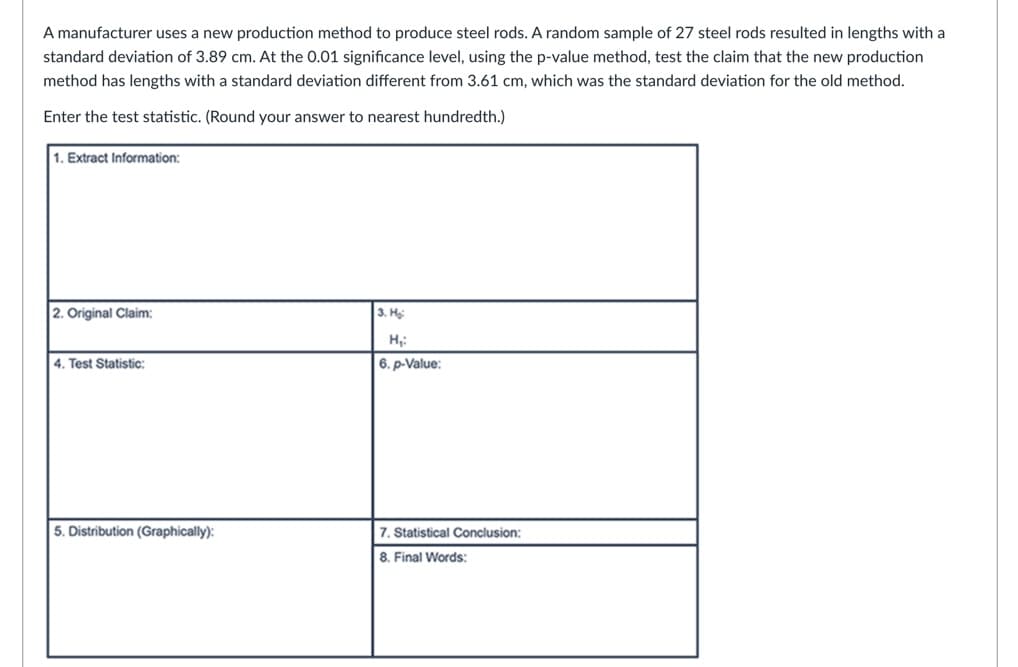
Transcribed Image Text:A manufacturer uses a new production method to produce steel rods. A random sample of 27 steel rods resulted in lengths with a
standard deviation of 3.89 cm. At the 0.01 significance level, using the p-value method, test the claim that the new production
method has lengths with a standard deviation different from 3.61 cm, which was the standard deviation for the old method.
Enter the test statistic. (Round your answer to nearest hundredth.)
1. Extract Information:
2. Original Claim:
3. Họ
H;:
4. Test Statistic:
6. p-Value:
5. Distribution (Graphically):
7. Statistical Conclusion:
8. Final Words:
Expert Solution
Step 1
Given,
A random sample of 27 steel rods
n=27
Standard deviation (sd) from new production method=s =3.89
Standard deviation (sd) from new production method==3.61
Level of significance () =0.01

Trending now
This is a popular solution!

Step by step
Solved in 2 steps

Knowledge Booster


Learn more about
Need a deep-dive on the concept behind this application? Look no further. Learn more about this topic, statistics and related others by exploring similar questions and additional content below.Recommended textbooks for you
MATLAB: An Introduction with Applications
Statistics
ISBN:
9781119256830
Author:
Amos Gilat
Publisher:
John Wiley & Sons Inc

Probability and Statistics for Engineering and th…
Statistics
ISBN:
9781305251809
Author:
Jay L. Devore
Publisher:
Cengage Learning

Statistics for The Behavioral Sciences (MindTap C…
Statistics
ISBN:
9781305504912
Author:
Frederick J Gravetter, Larry B. Wallnau
Publisher:
Cengage Learning
MATLAB: An Introduction with Applications
Statistics
ISBN:
9781119256830
Author:
Amos Gilat
Publisher:
John Wiley & Sons Inc
Probability and Statistics for Engineering and th…
Statistics
ISBN:
9781305251809
Author:
Jay L. Devore
Publisher:
Cengage Learning
Statistics for The Behavioral Sciences (MindTap C…
Statistics
ISBN:
9781305504912
Author:
Frederick J Gravetter, Larry B. Wallnau
Publisher:
Cengage Learning

Elementary Statistics: Picturing the World (7th E…
Statistics
ISBN:
9780134683416
Author:
Ron Larson, Betsy Farber
Publisher:
PEARSON

The Basic Practice of Statistics
Statistics
ISBN:
9781319042578
Author:
David S. Moore, William I. Notz, Michael A. Fligner
Publisher:
W. H. Freeman

Introduction to the Practice of Statistics
Statistics
ISBN:
9781319013387
Author:
David S. Moore, George P. McCabe, Bruce A. Craig
Publisher:
W. H. Freeman