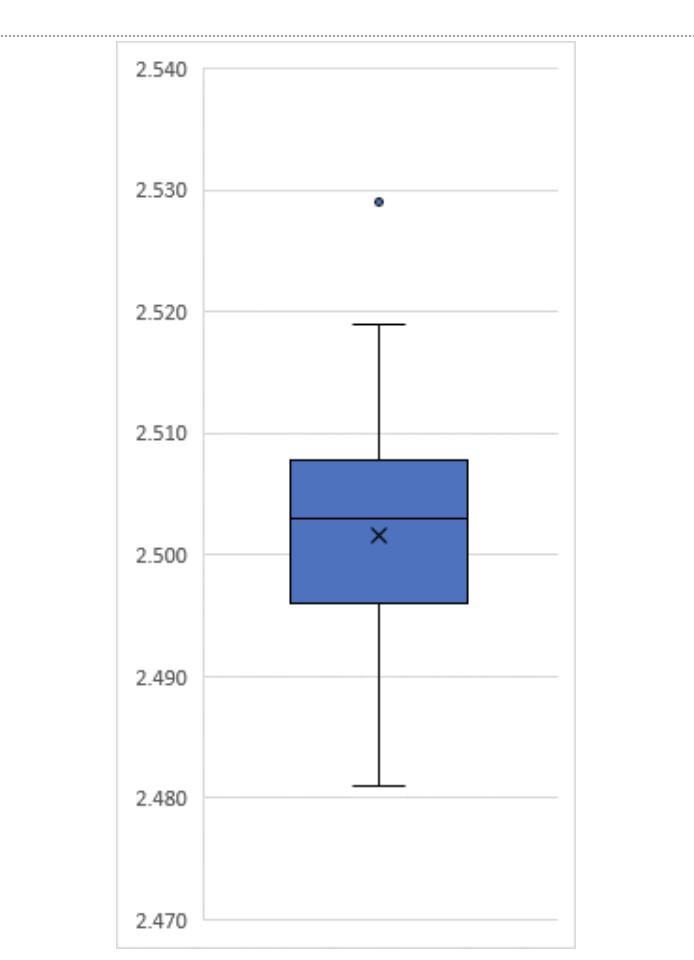
A manufacturing company produces metal pipes with a desired width of 2.5 cm. Due to machine error, the pipes vary somewhat from this target. The company takes a sample of 100 pipes produced. The observed mean pipe width was approximately 2.502 and the sample standard deviation was 0.00932. The company also determined that the cutoff measurement for the widest 2.5% of pipes that were observed is 2.519. The research department of the company believes that the width of the pipes is normally distributed, with a mean of 2.5 cm and a standard deviation of 0.01. If that is the case, what should the cutoff be for the widest 2.5% of pipes be? Using any of the information above, do you think the research department’s beliefs about the distribution of the tube widths are plausible? Explain your reasoning. (Hint: How do the observed mean, standard deviation, and percentile cutoffs compare to the research’s teams baseline assumptions?) The box-and-whisker plot below represents the tube width data from the previous problem. One value is represented as a point. What is the significance of that? What does the line drawn through the blue box represent? What does the “x” inside of the box represent? What is the significance of the fact that the line and the “x” are in different places?
A manufacturing company produces metal pipes with a desired width of 2.5 cm. Due to machine error, the pipes vary somewhat from this target. The company takes a sample of 100 pipes produced. The observed mean pipe width was approximately 2.502 and the sample standard deviation was 0.00932. The company also determined that the cutoff measurement for the widest 2.5% of pipes that were observed is 2.519. The research department of the company believes that the width of the pipes is normally distributed, with a mean of 2.5 cm and a standard deviation of 0.01. If that is the case, what should the cutoff be for the widest 2.5% of pipes be? Using any of the information above, do you think the research department’s beliefs about the distribution of the tube widths are plausible? Explain your reasoning. (Hint: How do the observed mean, standard deviation, and percentile cutoffs compare to the research’s teams baseline assumptions?) The box-and-whisker plot below represents the tube width data from the previous problem. One value is represented as a point. What is the significance of that? What does the line drawn through the blue box represent? What does the “x” inside of the box represent? What is the significance of the fact that the line and the “x” are in different places?

College Algebra (MindTap Course List)
12th Edition
ISBN:9781305652231
Author:R. David Gustafson, Jeff Hughes
Publisher:R. David Gustafson, Jeff Hughes
Chapter8: Sequences, Series, And Probability
Section8.CT: Chapter Test
Problem 16CT: How many six-digit license plates can be made if no plate begins with 0 or 1?

Related questions
Question
A manufacturing company produces metal pipes with a desired width of 2.5 cm. Due to machine error, the pipes vary somewhat from this target. The company takes a sample of 100 pipes produced. The observed mean pipe width was approximately 2.502 and the sample standard deviation was 0.00932. The company also determined that the cutoff measurement for the widest 2.5% of pipes that were observed is 2.519.
- The research department of the company believes that the width of the pipes is
normally distributed , with a mean of 2.5 cm and a standard deviation of 0.01. If that is the case, what should the cutoff be for the widest 2.5% of pipes be?
- Using any of the information above, do you think the research department’s beliefs about the distribution of the tube widths are plausible? Explain your reasoning. (Hint: How do the observed mean, standard deviation, and percentile cutoffs compare to the research’s teams baseline assumptions?)
- The box-and-whisker plot below represents the tube width data from the previous problem.
- One value is represented as a point. What is the significance of that?
- What does the line drawn through the blue box represent?
- What does the “x” inside of the box represent?
- What is the significance of the fact that the line and the “x” are in different places?
Transcribed Image Text:2.540
2.530
2.520
2.510
2.500
2.490
2.480
2.470
X
Expert Solution
This question has been solved!
Explore an expertly crafted, step-by-step solution for a thorough understanding of key concepts.

Step by step
Solved in 4 steps

Recommended textbooks for you
College Algebra (MindTap Course List)
Algebra
ISBN:
9781305652231
Author:
R. David Gustafson, Jeff Hughes
Publisher:
Cengage Learning
College Algebra (MindTap Course List)
Algebra
ISBN:
9781305652231
Author:
R. David Gustafson, Jeff Hughes
Publisher:
Cengage Learning