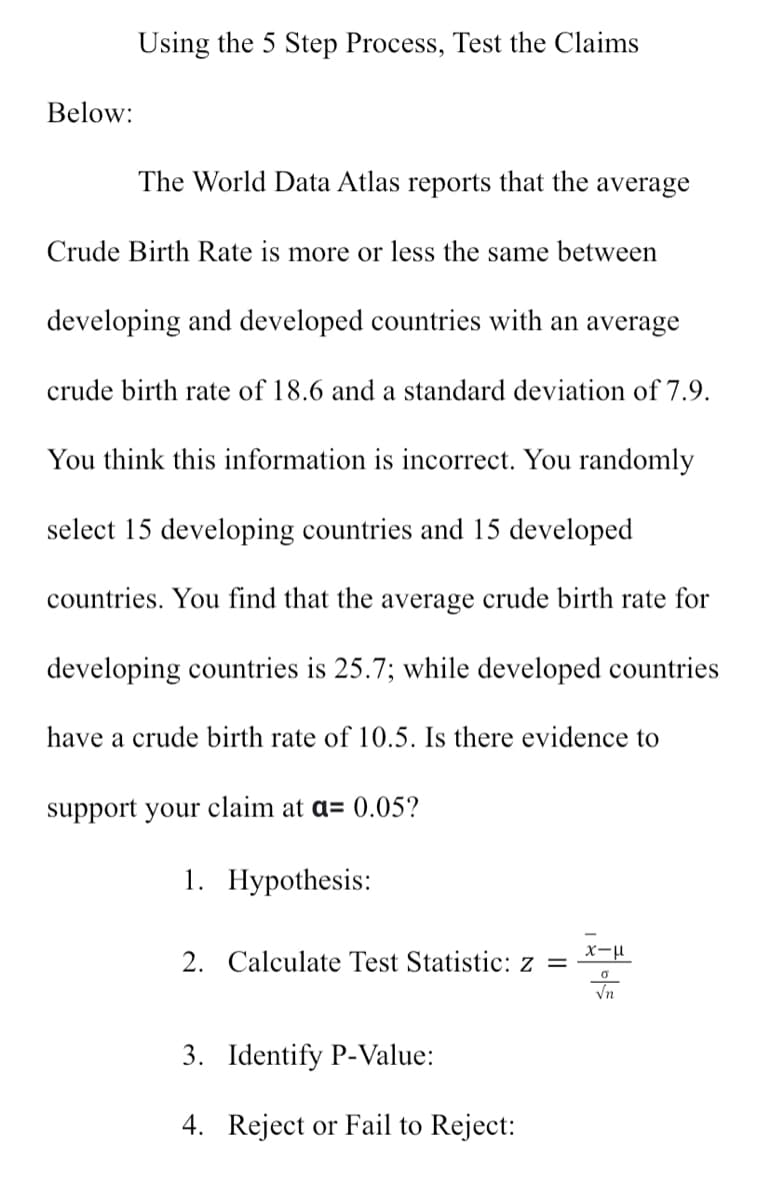
Below: Using the 5 Step Process, Test the Claims The World Data Atlas reports that the average Crude Birth Rate is more or less the same between developing and developed countries with an average crude birth rate of 18.6 and a standard deviation of 7.9. You think this information is incorrect. You randomly select 15 developing countries and 15 developed countries. You find that the average crude birth rate for developing countries is 25.7; while developed countries have a crude birth rate of 10.5. Is there evidence to support your claim at a= 0.05? 1. Hypothesis: 2. Calculate Test Statistic: z = 3. Identify P-Value: 4. Reject or Fail to Reject: x-μ 0
Below: Using the 5 Step Process, Test the Claims The World Data Atlas reports that the average Crude Birth Rate is more or less the same between developing and developed countries with an average crude birth rate of 18.6 and a standard deviation of 7.9. You think this information is incorrect. You randomly select 15 developing countries and 15 developed countries. You find that the average crude birth rate for developing countries is 25.7; while developed countries have a crude birth rate of 10.5. Is there evidence to support your claim at a= 0.05? 1. Hypothesis: 2. Calculate Test Statistic: z = 3. Identify P-Value: 4. Reject or Fail to Reject: x-μ 0

MATLAB: An Introduction with Applications
6th Edition
ISBN:9781119256830
Author:Amos Gilat
Publisher:Amos Gilat
Chapter1: Starting With Matlab
Section: Chapter Questions
Problem 1P

Related questions
Question
Transcribed Image Text:Below:
Using the 5 Step Process, Test the Claims
The World Data Atlas reports that the average
Crude Birth Rate is more or less the same between
developing and developed countries with an average
crude birth rate of 18.6 and a standard deviation of 7.9.
You think this information is incorrect. You randomly
select 15 developing countries and 15 developed
countries. You find that the average crude birth rate for
developing countries is 25.7; while developed countries
have a crude birth rate of 10.5. Is there evidence to
support your claim at a= 0.05?
1. Hypothesis:
2. Calculate Test Statistic: z =
3. Identify P-Value:
4. Reject or Fail to Reject:
x-μ
0
√n
Expert Solution
This question has been solved!
Explore an expertly crafted, step-by-step solution for a thorough understanding of key concepts.

This is a popular solution!

Trending now
This is a popular solution!

Step by step
Solved in 3 steps

Recommended textbooks for you
MATLAB: An Introduction with Applications
Statistics
ISBN:
9781119256830
Author:
Amos Gilat
Publisher:
John Wiley & Sons Inc

Probability and Statistics for Engineering and th…
Statistics
ISBN:
9781305251809
Author:
Jay L. Devore
Publisher:
Cengage Learning

Statistics for The Behavioral Sciences (MindTap C…
Statistics
ISBN:
9781305504912
Author:
Frederick J Gravetter, Larry B. Wallnau
Publisher:
Cengage Learning
MATLAB: An Introduction with Applications
Statistics
ISBN:
9781119256830
Author:
Amos Gilat
Publisher:
John Wiley & Sons Inc
Probability and Statistics for Engineering and th…
Statistics
ISBN:
9781305251809
Author:
Jay L. Devore
Publisher:
Cengage Learning
Statistics for The Behavioral Sciences (MindTap C…
Statistics
ISBN:
9781305504912
Author:
Frederick J Gravetter, Larry B. Wallnau
Publisher:
Cengage Learning

Elementary Statistics: Picturing the World (7th E…
Statistics
ISBN:
9780134683416
Author:
Ron Larson, Betsy Farber
Publisher:
PEARSON

The Basic Practice of Statistics
Statistics
ISBN:
9781319042578
Author:
David S. Moore, William I. Notz, Michael A. Fligner
Publisher:
W. H. Freeman

Introduction to the Practice of Statistics
Statistics
ISBN:
9781319013387
Author:
David S. Moore, George P. McCabe, Bruce A. Craig
Publisher:
W. H. Freeman