A marketing research company tests the effectiveness of three new flavorings for a new sauce using a sample of 30 people, divided randomly into three groups of 10 people each. Group 1 tastes Flavor 1, Group 2 tastes Flavor 2, and Group 3 tastes Flavor 3. Each person is then given a questionnaire that evaluates how enjoyable the beverage was. The scores are shown below. Determine whether there is a perceived significant difference between the three flavorings. Flayor 1 Flavor 2 Flavor 3
A marketing research company tests the effectiveness of three new flavorings for a new sauce using a sample of 30 people, divided randomly into three groups of 10 people each. Group 1 tastes Flavor 1, Group 2 tastes Flavor 2, and Group 3 tastes Flavor 3. Each person is then given a questionnaire that evaluates how enjoyable the beverage was. The scores are shown below. Determine whether there is a perceived significant difference between the three flavorings. Flayor 1 Flavor 2 Flavor 3

Big Ideas Math A Bridge To Success Algebra 1: Student Edition 2015
1st Edition
ISBN:9781680331141
Author:HOUGHTON MIFFLIN HARCOURT
Publisher:HOUGHTON MIFFLIN HARCOURT
Chapter11: Data Analysis And Displays
Section11.4: Two-ways Tables
Problem 5E

Related questions
Question
This question is Only for who knows well the answer and the excel formula. I don't need only the filling numbers I need you to give the exact excel formula to answer the question. The correct EXCEL FORMULA.
Please don't send a blank page.
I had received a blank page before. Thank you!
Transcribed Image Text:File
Home
Insert
Draw
Formulas
Data
Review
View
Help
Ø Editing v
Calibri
B
A
$v品 囲、、
...
General
0
00
國、囲v
fx Accessibility tab summary: Given information for this question is presented in rows 2 through 17. Requirement information is presented in rows 20 through 32.
00
A1
A.
B
C
E
F
G
H
M
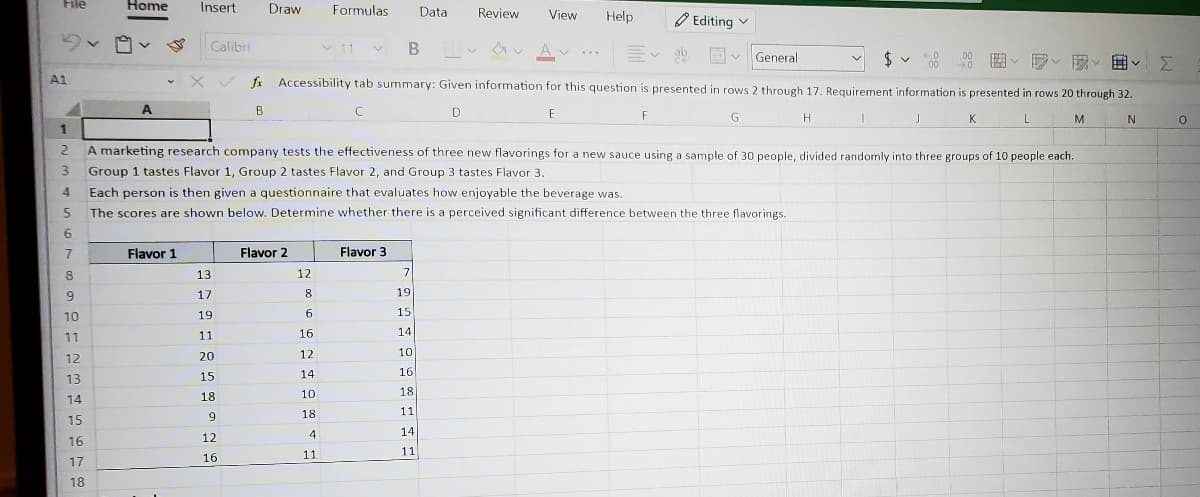
A marketing research company tests the effectiveness of three new flavorings for a new sauce using a sample of 30 people, divided randomly into three groups of 10 people each.
3.
Group 1 tastes Flavor 1, Group 2 tastes Flavor 2, and Group 3 tastes Flavor 3.
4.
Each person is then given a questionnaire that evaluates how enjoyable the beverage was.
5.
The scores are shown below. Determine whether there is a perceived significant difference between the three flavorings.
6.
Flavor 1
Flavor 2
Flavor 3
8.
13
12
9
17
8
19
10
19
6
15
11
11
16
14
12
20
12
10
15
14
16
13
18
10
18
14
9
18
11
15
4
14
16
12
11
11
16
17
18
Transcribed Image Text:A1
fx Accessibility tab summary: Given information for this question is presented in rows 2 through 17. Requirement information is p
B
E
18
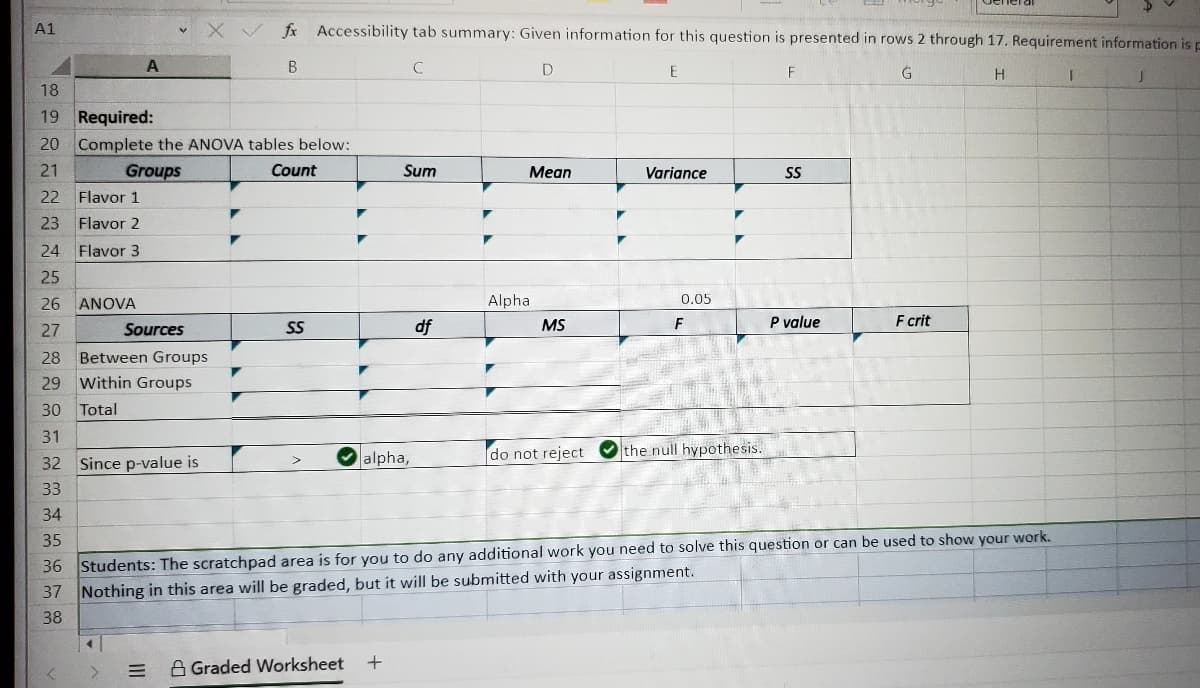
19 Required:
20 Complete the ANOVA tables below:
21
Groups
Count
Sum
Mean
Variance
SS
22
Flavor 1
23
Flavor 2
24
Flavor 3
25
26 ANOVA
Alpha
0.05
SS
df
MS
P value
F crit
27
Sources
28 Between Groups
29 within Groups
30 Total
31
32 Since p-value is
alpha,
do not reject
the null hypothesis.
33
34
36 Students: The scratchpad area is for you to do any additional work you need to solve this question or can be used to show your work.
37 Nothing in this area will be graded, but it will be submitted with your assignment.
35
38
A Graded Worksheet
II
Expert Solution
This question has been solved!
Explore an expertly crafted, step-by-step solution for a thorough understanding of key concepts.

This is a popular solution!

Trending now
This is a popular solution!

Step by step
Solved in 2 steps with 2 images

Recommended textbooks for you
Big Ideas Math A Bridge To Success Algebra 1: Stu…
Algebra
ISBN:
9781680331141
Author:
HOUGHTON MIFFLIN HARCOURT
Publisher:
Houghton Mifflin Harcourt

Holt Mcdougal Larson Pre-algebra: Student Edition…
Algebra
ISBN:
9780547587776
Author:
HOLT MCDOUGAL
Publisher:
HOLT MCDOUGAL

Glencoe Algebra 1, Student Edition, 9780079039897…
Algebra
ISBN:
9780079039897
Author:
Carter
Publisher:
McGraw Hill
Big Ideas Math A Bridge To Success Algebra 1: Stu…
Algebra
ISBN:
9781680331141
Author:
HOUGHTON MIFFLIN HARCOURT
Publisher:
Houghton Mifflin Harcourt
Holt Mcdougal Larson Pre-algebra: Student Edition…
Algebra
ISBN:
9780547587776
Author:
HOLT MCDOUGAL
Publisher:
HOLT MCDOUGAL
Glencoe Algebra 1, Student Edition, 9780079039897…
Algebra
ISBN:
9780079039897
Author:
Carter
Publisher:
McGraw Hill